
What is the GE Business Screen?
The GE Business Screen — also called the GE matrix or the GE-McKinsey matrix — is a portfolio tool that places each business unit on a nine-cell grid built from two composite scores: industry attractiveness and business unit strength. It was developed by McKinsey & Company for General Electric in the early 1970s, when GE found the Boston Matrix too blunt for a conglomerate running dozens of very different businesses.
The complaint was specific. The Boston Matrix judges a market by its growth rate alone and a company’s position by relative market share alone. GE’s managers could name markets that were growing fast and still unattractive, and units with modest share that were nonetheless very strong. Two single numbers could not carry that.
The two composite scores
Industry attractiveness replaces market growth. It is built from several weighted factors — market size and growth, margins, competitive intensity, cyclicality, regulation, technological requirements, and anything else that makes a market worth being in. Each factor is scored and weighted, and the weighted scores are summed.
Business unit strength replaces relative market share. It is built the same way from market share, brand strength, cost position, distribution reach, technical capability, margin relative to rivals, and management depth.
Both axes are then split into high, medium and low, producing nine cells rather than four. Hax and Majluf (1983) set out the method in detail and make the important point that the weightings are the analysis: two managers can place the same unit in different cells simply by disagreeing about what matters, and that disagreement is worth surfacing rather than hiding.
Reading the nine cells
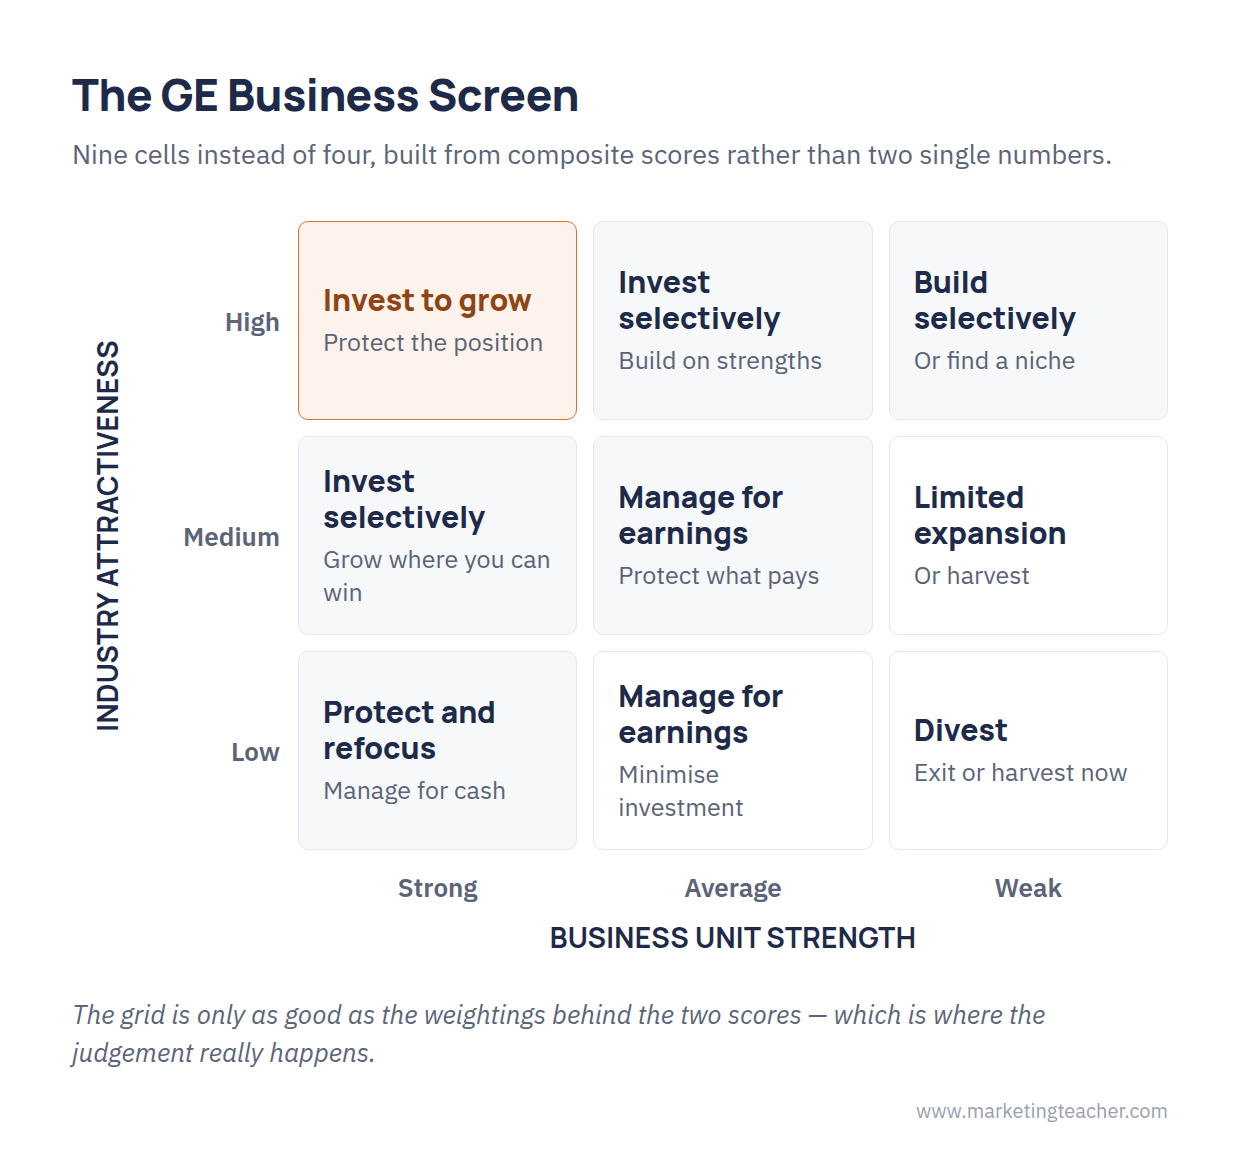
The grid resolves into three zones. The three cells in the top-left corner — strong units in attractive industries — are the invest and grow zone, where the company protects its position and funds expansion. The three cells on the diagonal are the selective zone, where investment has to be justified case by case and often means finding a defensible niche rather than attacking the whole market. The three cells in the bottom-right are the harvest or divest zone: manage for cash, minimise investment, and exit when the return no longer justifies the capital.
Worked example
How it compares with the Boston Matrix
The screen is more thorough and slower. It needs data the Boston Matrix does not, and it needs agreement on weightings before it produces anything. In exchange it handles the cases that make the simpler model look foolish: the fast-growing market nobody makes money in, the small-share unit with a cost advantage nobody can match.
It also inherits the family weakness. Armstrong and Brodie (1994) found experimentally that people handed portfolio-matrix output made investment choices that were unprofitable on the numbers in front of them — the grid’s apparent authority displaced the arithmetic. A nine-cell grid built from subjective weightings is, if anything, more open to that than a four-cell one, because the scoring work makes the output look more objective than it is. The other models in the family are set out on the portfolio analysis page.
Summary
The GE Business Screen replaces the Boston Matrix’s two single measures with two weighted composite scores — industry attractiveness and business unit strength — and splits each into high, medium and low to give nine cells. Top-left means invest and grow, the diagonal means invest selectively, bottom-right means harvest or divest. It is more thorough than the Boston Matrix and more demanding, and its real content sits in the weightings rather than in the grid (Kotler and Armstrong, 2018).
The slides, worksheet, lesson plan and poster for this lesson are free to download and free to use in your course — no sign-up, no permission needed.

