
What is the Boston Matrix?
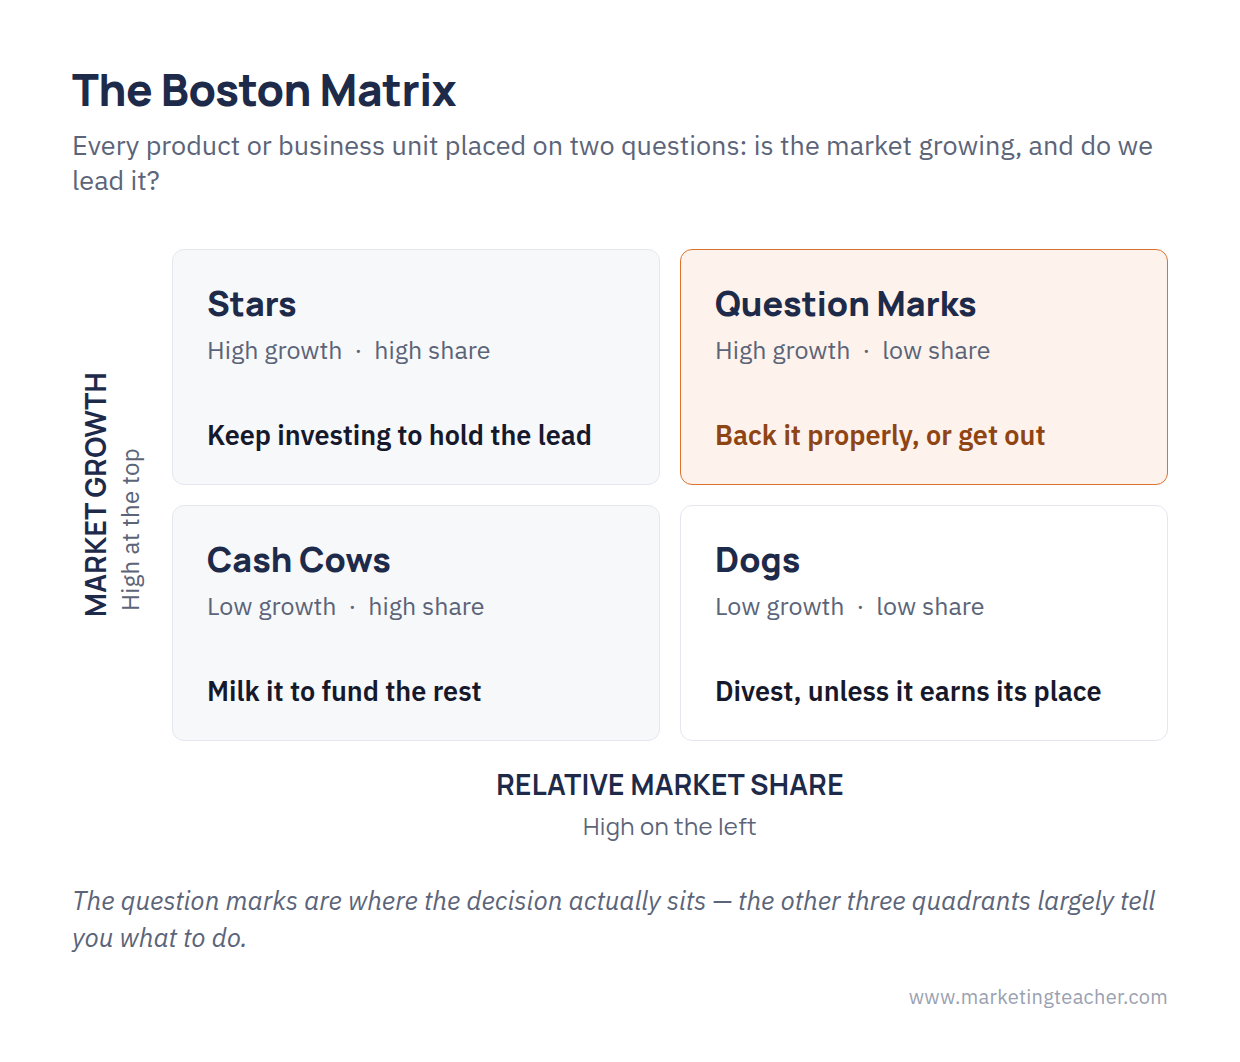
The Boston Matrix is a portfolio tool that asks two questions about every product a company sells: is the market growing, and do we lead it? Plotting each product against those two answers produces a simple grid of four cells, and each cell carries a different instruction about money. It was developed at the Boston Consulting Group and set out by Bruce Henderson (1970), which is why it is also known as the BCG matrix or the growth-share matrix.
The tool exists because a company with several products cannot judge them in isolation. A product that loses money may be worth keeping; a profitable one may be worth selling. What matters is the role each plays in the portfolio as a whole, and in particular which products generate cash and which consume it.
The two axes
The vertical axis is market growth rate — how fast the market for that product is expanding. Growing markets demand investment, because share has to be won and defended while the market is still moving. Mature markets demand much less.
The horizontal axis is relative market share — the company’s share compared with its largest competitor, not its share of the market as a whole. A 20% share is strong if the next firm holds 5% and weak if the next firm holds 50%. Relative share is used as a proxy for cost advantage: the firm with the largest share has usually produced the most units, and in many industries that brings lower unit costs. Note the convention that high share sits on the left of the grid, which catches people out.
The four quadrants
Stars have high share in a high-growth market. They are the business’s future, but they rarely fund themselves — holding a lead in a fast-moving market absorbs cash about as fast as it produces it. The aim is to keep investing so that, when the market matures, the star becomes a cash cow.
Cash cows have high share in a low-growth market. They generate far more cash than they need to reinvest, and that surplus is what pays for everything else. A cash cow is not exciting, and that is the point: it is the funding engine.
Question marks, sometimes called problem children, have low share in a high-growth market. They are the genuine decision. Invested in properly, a question mark can take share while the market is still forming and become a star. Half-funded, it will consume cash for years and arrive nowhere. The honest options are to back it seriously or to get out.
Dogs have low share in a low-growth market. The default is divestment, but not automatically — a dog may block a competitor, complete a range customers expect, or carry a brand into a channel that matters. It should earn its place rather than simply survive.
How to use it
Used properly, the matrix is a cash-allocation argument rather than a labelling exercise. The sequence is: place each unit, identify where the surplus is generated, and then decide which question marks that surplus should back. A portfolio with no cash cows cannot fund its own growth. A portfolio that is all cash cows has no future, because markets mature and today’s cow was yesterday’s star — which is why the matrix sits so naturally alongside the product life cycle.
The placements are also a prompt for strategy rather than a conclusion. A question mark that looks hopeless on share may look different once you have asked how the company might compete differently, which is where tools such as generic strategies and Ansoff’s matrix take over.
What the matrix misses
Two axes are a small number. Market growth and relative share say nothing about margin, capital intensity, regulation, the strength of a brand, or how related two units are to each other. A high-growth market may be high-growth precisely because it is easy to enter and about to become crowded.
There is also evidence that the tool can make decisions worse rather than better. Armstrong and Brodie (1994) ran experiments in which participants given portfolio-matrix output chose investments that were, on the numbers in front of them, clearly unprofitable — the grid’s apparent authority displaced the arithmetic. The matrix should inform a judgement, not replace one.
Later models were built to widen the view: the GE Business Screen, the Shell Directional Policy Matrix and the ADL matrix all replace the two simple axes with composite measures of market attractiveness and competitive strength (Kotler and Armstrong, 2018).
Summary
The Boston Matrix plots products on market growth and relative market share to produce four cells: stars, cash cows, question marks and dogs. Stars need funding to become tomorrow’s cash cows; cash cows generate the surplus; question marks are the decision the surplus has to settle; dogs go unless they earn their place. It is quick, it is a good way to see a whole portfolio at once, and it is too simple to be trusted on its own.
The slides, worksheet, lesson plan and poster for this lesson are free to download and free to use in your course — no sign-up, no permission needed. See the teacher resources →
Assign this lesson to your class:
Using Canvas, Blackboard or Moodle? Copy the link and paste it into your course page or assignment. More ways to add lessons to your LMS.

