
What is portfolio analysis?
Portfolio analysis is a family of tools that help a business with more than one product, brand or business unit decide where to invest, where to hold steady and where to pull back. Rather than judging each unit in isolation, portfolio analysis plots every unit on a grid — usually market attractiveness on one axis and competitive strength on the other — so a manager can see the whole business at once and allocate limited cash and management time accordingly.
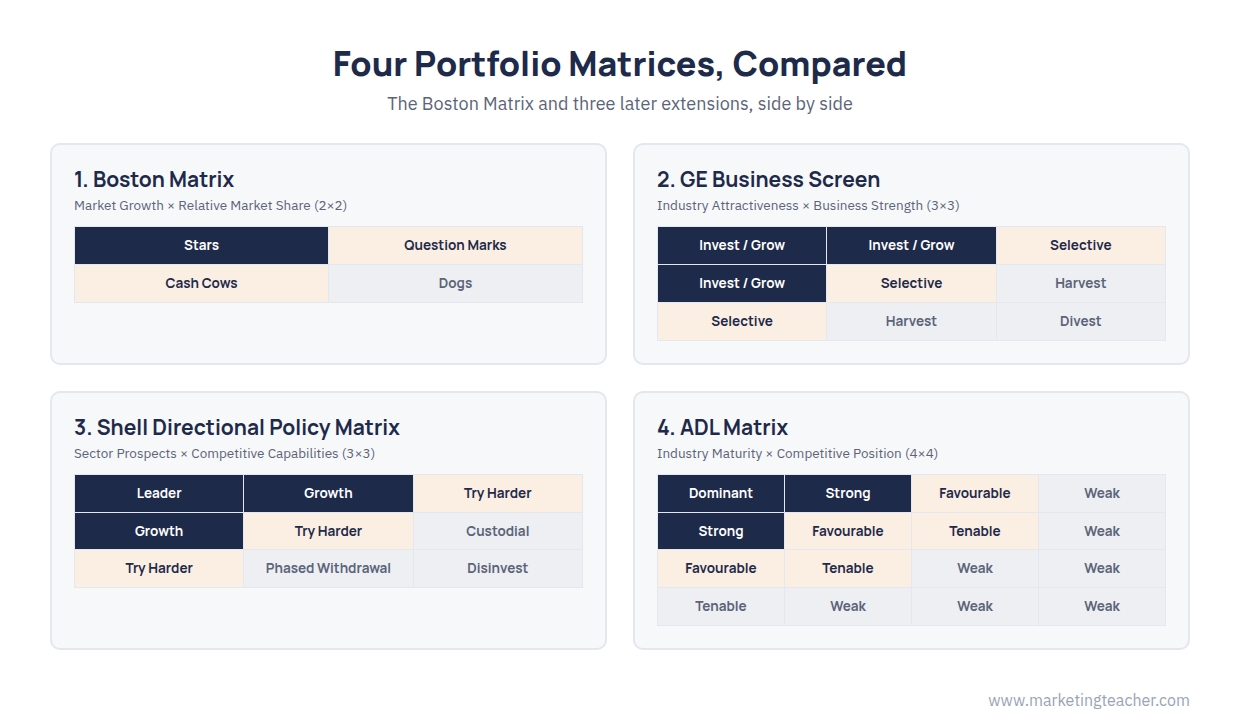
Four models dominate. They share the same logic and differ in how much detail they demand. The choice between them is a trade-off between speed and thoroughness, and the honest answer is that a quick model used well beats a detailed one used badly.
The Boston Matrix
The best known of the four. It plots each unit on market growth rate and relative market share to produce four cells — stars, cash cows, question marks and dogs — and reads off what each implies for cash. It is the quickest to apply and the most widely taught, which also makes it the most widely misused.
Read the full Boston Matrix lesson, which covers the two axes, the four quadrants, a worked example and the evidence on where the model misleads.
The GE Business Screen
The GE Business Screen, also known as the GE-McKinsey matrix, was developed by McKinsey & Company for General Electric in the early 1970s as a more detailed alternative to the Boston Matrix. It replaces the two simple metrics with two composite scores — industry attractiveness and business unit strength — each built from several weighted factors rather than a single number. That produces a nine-cell grid instead of four, splitting each axis into high, medium and low.
A unit scoring high on both is a clear candidate for continued investment; one scoring low on both is a candidate to harvest or exit; the middle cells call for selective, case-by-case judgement. The trade-off is that the screen requires far more data gathering and weighting than two simple metrics, which makes it more thorough but also more open to bias in how the scores are built.
The Shell Directional Policy Matrix
The Shell Directional Policy Matrix was developed independently at a similar time, and uses a similar nine-cell structure with axes built around Shell’s own strategic language: business sector prospects against the company’s competitive capabilities (Robinson, Hichens and Wade, 1978). Its nine positions carry more directive labels than the GE model’s — Leader, Growth, Try Harder, Custodial, Phased Withdrawal and Disinvest among them — intended to point managers toward a next action rather than leaving them to interpret a plain high/medium/low grid. Some of the original terminology is industry-specific, but the underlying idea generalises to any diversified company.
The ADL Matrix
The Arthur D. Little Strategic Condition Matrix takes a different pair of axes again: industry maturity — embryonic, growth, mature, ageing — against competitive position, from dominant through to weak (Hofer and Schendel, 1978). Its insight is that the right strategy depends heavily on the stage of the industry’s life cycle, not only on how strong a unit is today. A strong position in an ageing industry calls for a very different strategy from an identical position in an embryonic one.
That makes it particularly useful for a business operating across industries at different life-cycle stages at once, where the Boston Matrix’s simpler growth and share view can mislead. There is an ADL matrix exercise with a worked answer if you want to apply it.
Comparing the four
All four share the same core limitation: they reduce a complex business unit to a position on a grid, which oversimplifies real choices and encourages a false sense of precision, especially where the underlying scores are subjective. None of them handles interdependence well — a dog that supplies a critical component to a star may be worth keeping whatever the grid says.
In practice the Boston Matrix remains the quickest to apply, while the other three trade that simplicity for a multi-factor view better suited to genuinely difficult decisions. None should be the sole basis for a real investment decision. They are starting points for an argument, and they work best alongside a proper look at each unit with Five Forces and generic strategies.
Summary
Portfolio analysis helps a multi-product business decide where to put its money. The Boston Matrix sorts units by market growth and relative share; the GE Business Screen and the Shell Directional Policy Matrix extend that into a nine-cell grid built from composite attractiveness and strength scores; the ADL matrix swaps in industry life-cycle stage as its second axis. All four simplify, and that is both why they are useful and why they should never be the last word.
The slides, worksheet, lesson plan and poster for this lesson are free to download and free to use in your course — no sign-up, no permission needed.

