
What is the Shell Directional Policy Matrix?
The Shell Directional Policy Matrix is a portfolio tool that places each business unit on a nine-cell grid formed by two axes: the prospects of the business sector, and the company’s competitive capabilities within it. It was developed inside Shell and published by Robinson, Hichens and Wade (1978), at a similar time to the GE Business Screen and with a similar nine-cell shape.
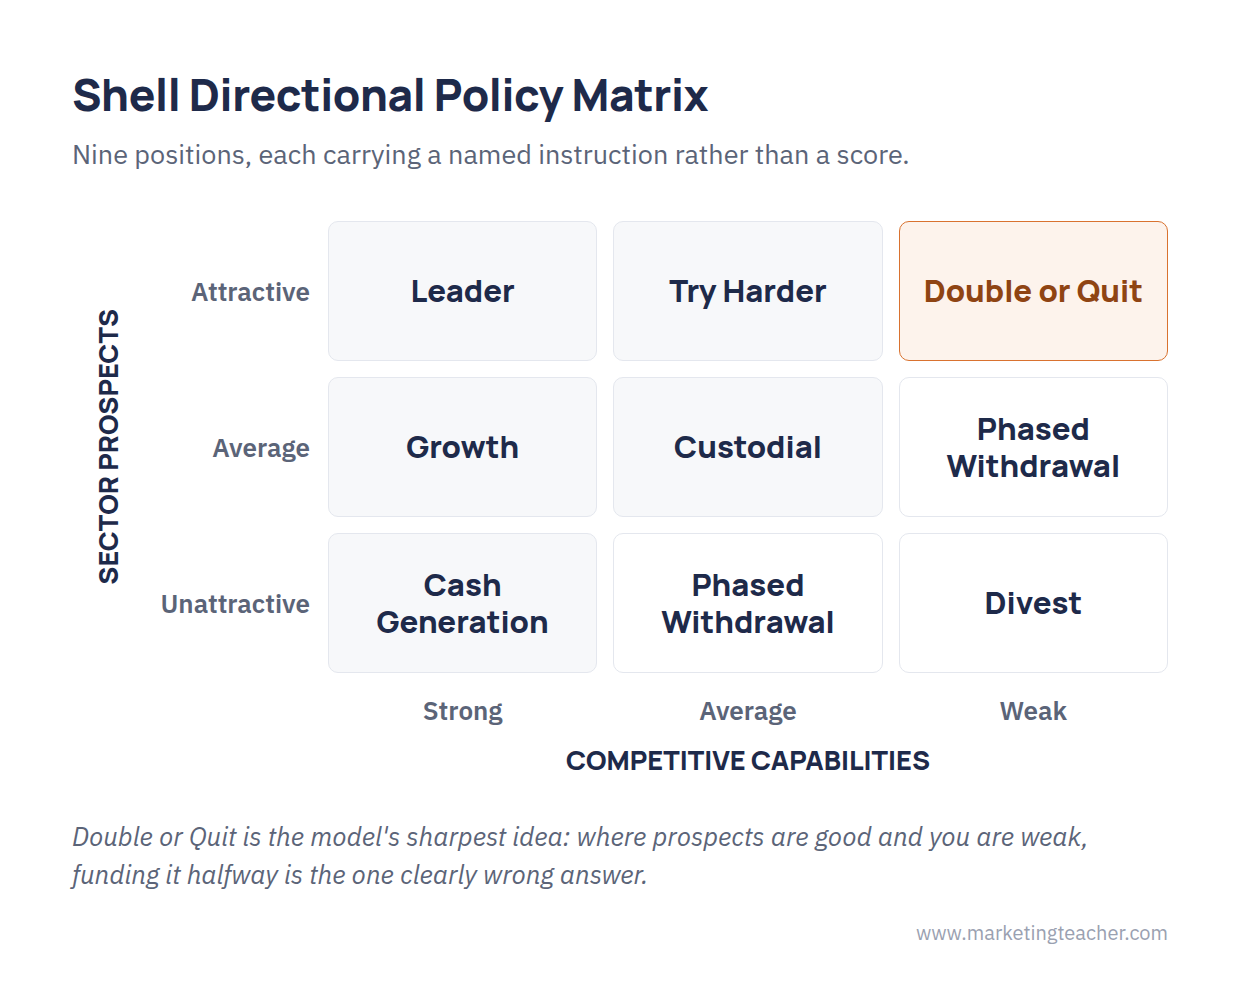
What distinguishes it is the language. Where other portfolio models leave a manager to interpret a position on a grid, the Shell matrix names each of its nine positions with an instruction: Leader, Try Harder, Double or Quit, Growth, Custodial, Phased Withdrawal, Cash Generation, Divest. The intent was to shorten the distance between reading the grid and doing something.
The two axes
Business sector prospects asks how attractive the sector itself is, judged on growth, market quality, supply position and environmental or regulatory constraints. “Market quality” is the interesting one and is unusual among portfolio models: it asks whether the sector has historically produced stable, decent margins, or whether profits have been volatile and competed away.
Company competitive capabilities asks how well placed this company is, judged on market position, production capability and product research and development. Both axes are scored, usually on a simple points scale, and both are split into three bands.
The nine positions
Strong capability in a sector with good prospects is Leader — the unit gets the resources it needs. Alongside it sit Try Harder, where prospects are good but the company is only average and must close the gap or lose the chance, and Double or Quit, the most quoted of the labels: prospects are attractive, the company is weak, and half-measures are the one clearly wrong answer.
The middle band holds Growth and Custodial, where the unit is worth keeping but not worth heavy funding, and the instruction is to take the cash without starving it. The weakest band holds Cash Generation, Phased Withdrawal and Divest — an ordered retreat rather than a single exit decision, which is realistic for the capital-intensive businesses the model was built for.
How it compares
The Shell matrix and the GE Business Screen are close relatives: both are nine-cell grids built from composite scores, both were answers to the same complaint that the Boston Matrix was too blunt. The Shell model is the more prescriptive of the two, and the more industry-specific — its original terminology came from a capital-intensive business with long investment cycles, and some of it reads that way.
The prescriptive labels are a genuine strength and a genuine risk. They make the output actionable, and they also make it feel more certain than the underlying scoring deserves. A unit does not become a Divest because the grid says so; it lands there because of weightings somebody chose. The other models in the family, and what they trade off against each other, are set out on the portfolio analysis page.
Summary
The Shell Directional Policy Matrix plots business sector prospects against company competitive capabilities on a nine-cell grid, and gives each position a named strategy from Leader through to Divest. It is close kin to the GE Business Screen, more directive in its language, and shaped by the capital-intensive industry it was built in. Like every model in the family, its output is only as sound as the scoring behind it.
The slides, worksheet, lesson plan and poster for this lesson are free to download and free to use in your course — no sign-up, no permission needed.

