
What is the ADL matrix?
The ADL matrix — properly the Arthur D. Little Strategic Condition Matrix, after the consultancy that developed it — places each business unit on a grid formed by two axes: the maturity of its industry, and the unit’s competitive position within that industry. Its distinguishing move is the first axis. Where other portfolio models measure how attractive a market is right now, the ADL matrix asks how far through its life the industry has travelled (Hofer and Schendel, 1978).
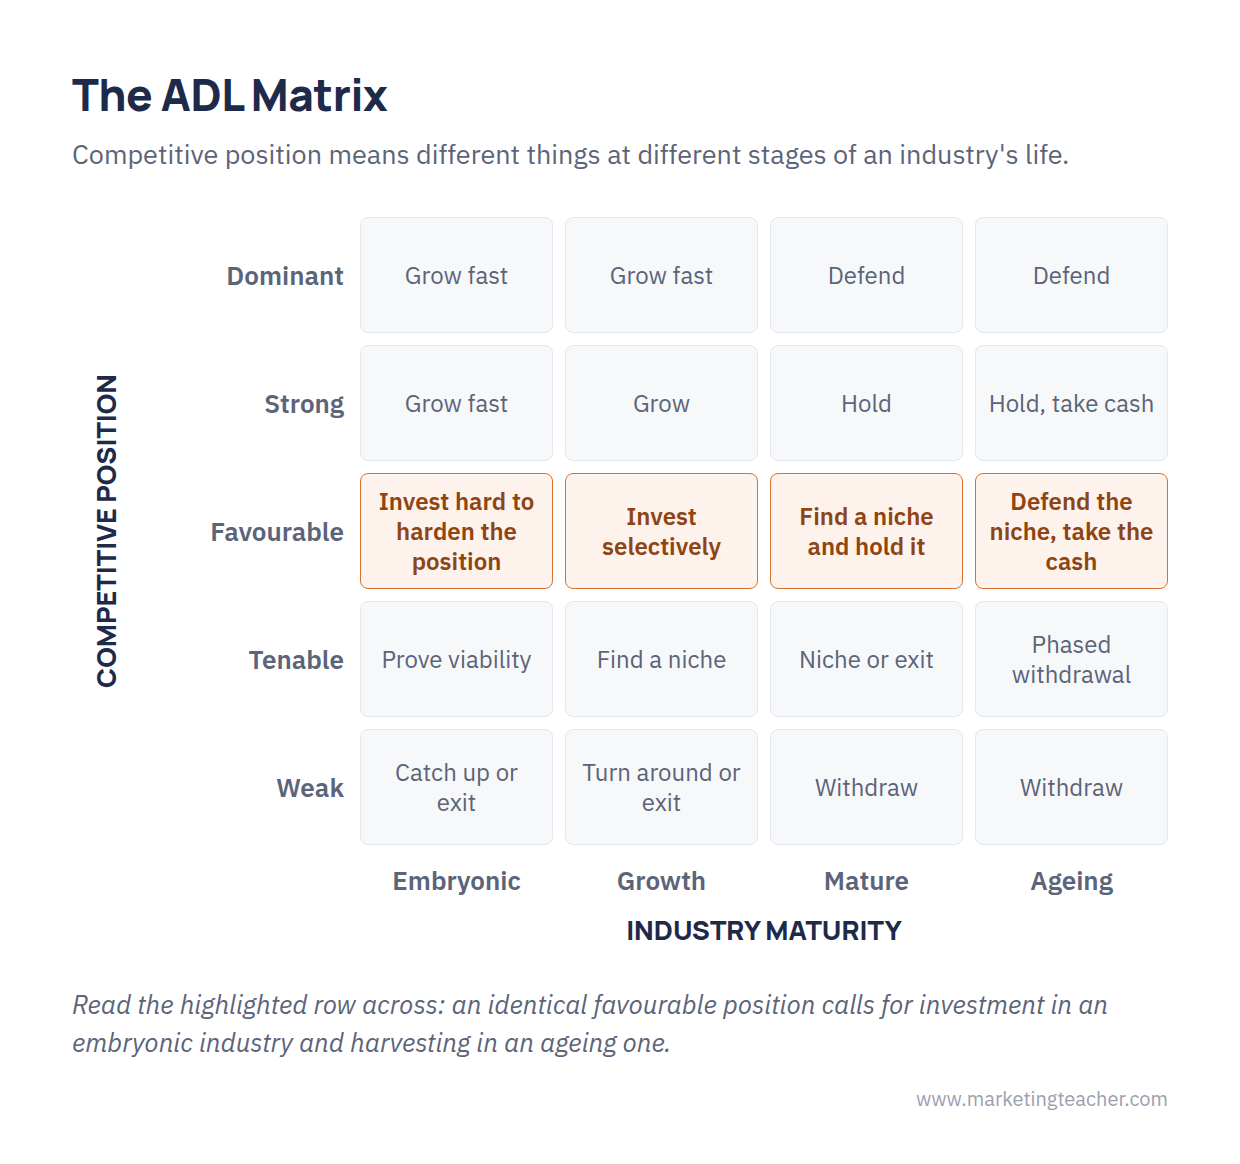
That matters because the same competitive position means different things at different stages. A strong number two in an embryonic industry has everything to play for. A strong number two in an ageing industry is defending a position that will not grow again, and should be managed accordingly.
The two axes
Industry maturity has four stages: embryonic, growth, mature and ageing. These are read from the industry’s behaviour rather than its age — growth rate, the rate at which technology and product specifications are still changing, how stable the customer base and the competitor set have become, and whether barriers to entry are still forming or have settled. It is the same underlying idea as the product life cycle, applied to a whole industry rather than one product.
Competitive position has five bands: dominant, strong, favourable, tenable and weak. Dominant is rare and usually means the unit sets the terms of the market. Tenable means the unit survives, typically in a niche, but has no power over the market. Weak means its position is not sustainable without change.
Four stages against five positions gives twenty cells — more granular than the nine-cell models, and the reason the ADL matrix is usually presented as a table of recommended strategies rather than a picture.
How it compares
The ADL matrix is the most granular of the four portfolio models and the most demanding to populate, which is why it is the least used of them in teaching. Its advantage shows in a company operating across industries at genuinely different life-cycle stages, where the Boston Matrix would compress that difference into a single growth-rate number and mislead.
It shares the family weakness. Twenty cells built from two judged scores can look far more precise than the judgements underneath them, and maturity in particular is contested — industries have been declared ageing and then restarted by a technology shift. The four models and their trade-offs are compared on the portfolio analysis page.
There is an ADL matrix exercise with a worked answer if you want to apply it to a case.
Summary
The ADL matrix plots industry maturity — embryonic, growth, mature, ageing — against competitive position, from dominant through to weak, producing twenty cells and a table of recommended strategies. Its value is that it refuses to treat a competitive position as meaningful in isolation. Its cost is the granularity: more judgement calls, each of them contestable, and a grid that looks more precise than the reasoning behind it.
The slides, worksheet, lesson plan and poster for this lesson are free to download and free to use in your course — no sign-up, no permission needed.

