
This is the suggested answer to the GE Business Screen exercise on Northwind Industries.
Unit A, Commercial Heat Pumps: Build Selectively
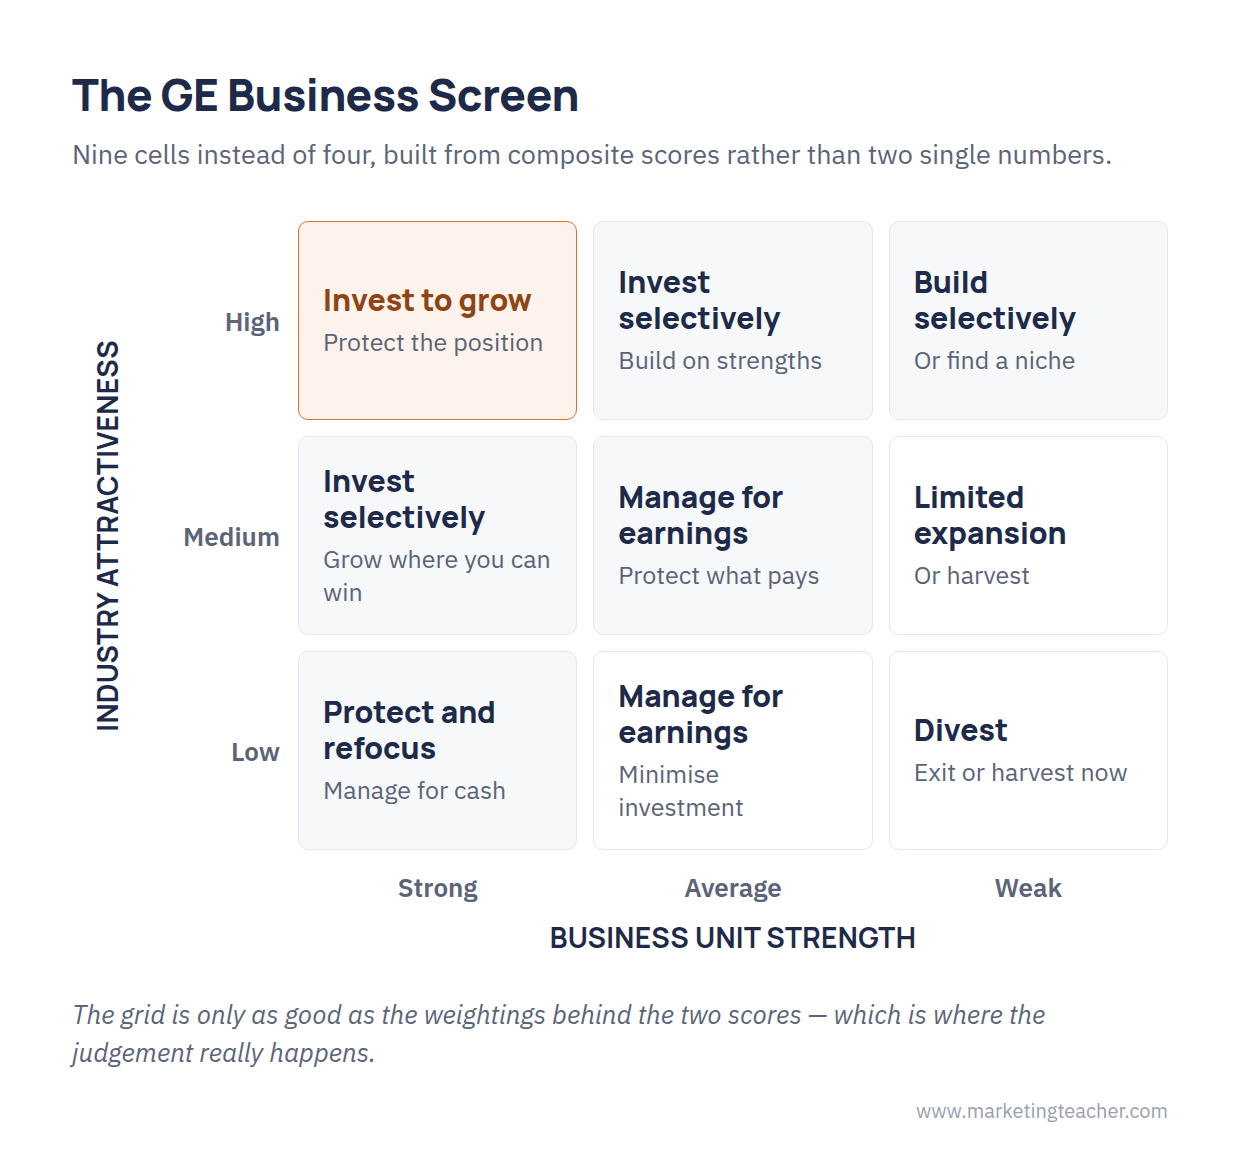
Industry attractiveness comes to (5×0.3) + (3×0.3) + (2×0.2) + (5×0.2) = 1.5 + 0.9 + 0.4 + 1.0 = 3.8 — high. Business unit strength comes to (2×0.4) + (2×0.3) + (4×0.3) = 0.8 + 0.6 + 1.2 = 2.6 — medium. That places Unit A in an attractive industry with a middling position: build selectively. The cost position of 4 is the asset to build on, so the instruction is to pick the segments where low cost wins the order, rather than fund a broad assault on a market where several better-funded rivals have just arrived.
Unit B, Industrial Fasteners: Manage for Earnings
Industry attractiveness comes to (1×0.3) + (4×0.3) + (4×0.2) + (2×0.2) = 0.3 + 1.2 + 0.8 + 0.4 = 2.7 — medium. Business unit strength comes to (5×0.4) + (4×0.3) + (4×0.3) = 2.0 + 1.2 + 1.2 = 4.4 — strong. A strong unit in a middling industry: protect the position, manage for earnings, and do not fund growth the market cannot deliver.
The Harder Question
Unit B scores higher overall, and it is the wrong place for the investment budget. Unit B is where the cash is generated; Unit A is where it should be spent. A strong unit in a slow market cannot convert extra investment into growth, while a medium unit in a growing market still can — provided the spending is focused. This is the point the grid makes and a scorecard would not.
The same portfolio decision, judged on two simpler axes, appears in the Boston Matrix exercise.
The slides, worksheet, lesson plan and poster for this lesson are free to download and free to use in your course — no sign-up, no permission needed.

