
What Is Mobile App Analytics?
Mobile app analytics is the practice of tracking what users actually do inside a business’s own app — which screens they open, which buttons they tap, how long they stay in a session, and whether they come back the next day or the next week. An early large-scale academic study of mobile application usage tracked over 4,000 real users across their everyday app sessions and found clear, measurable patterns in how often people opened apps and how long each session lasted (Böhmer et al., 2011) — exactly the kind of behavioural signal that mobile app analytics tools are built to capture continuously today. This lesson is scoped specifically to that in-app behaviour; measuring which marketing channel or campaign brought a user to the app in the first place is a separate discipline covered in Mobile Marketing Analytics.
The Core Metrics Marketers Actually Track
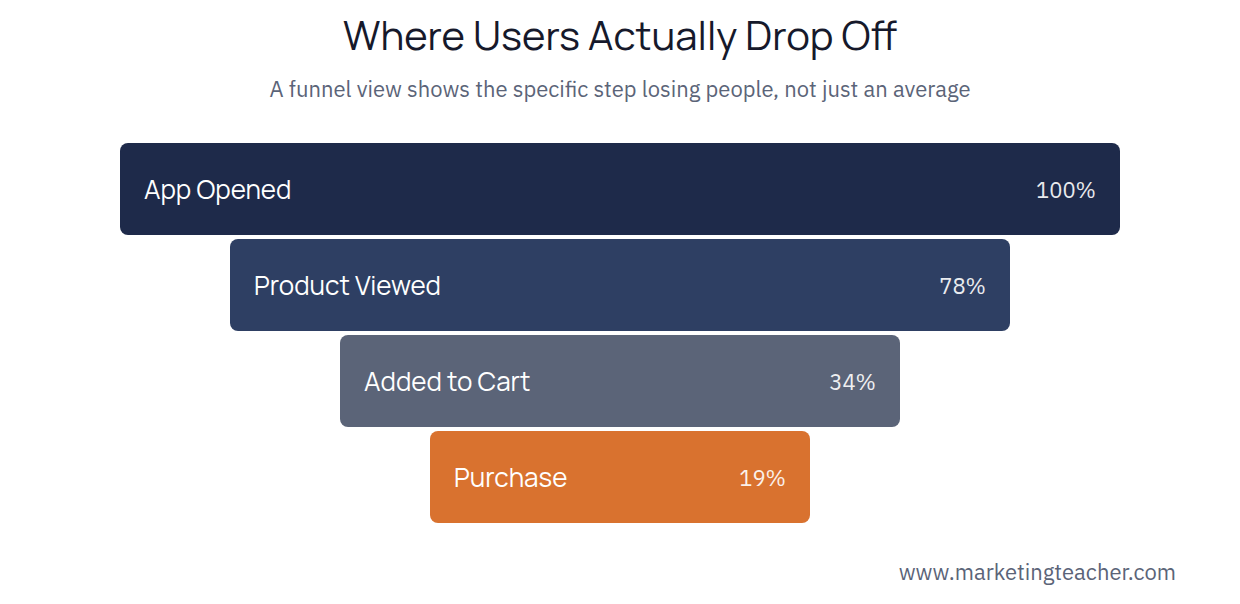
Four metrics account for most of what a marketing team monitors inside an app. Session frequency and length show how often and how deeply people engage once they’re in the app. Screen flow shows the actual path users take between screens, which usually looks messier than the path the app was designed around. Funnel drop-off tracks how many users complete each step of a defined sequence — browse, add to cart, checkout — and, critically, exactly where they abandon it. Cohort retention groups users by when they first installed the app and tracks what percentage of each group is still active a day, a week, and a month later, which shows whether the app is actually building a habit or just attracting one-time downloads.
Why the Funnel Matters More Than the Average
A single average conversion rate hides exactly where a marketing team should focus, while the funnel view shows the specific step losing the most people. A drop-off concentrated between “product viewed” and “added to cart” points to a pricing or product-page problem; a drop-off concentrated at checkout points to a friction problem in the payment flow itself — two completely different fixes that an average number alone can’t distinguish between.
What Cohort Retention Adds That a Snapshot Can’t
Looking at how many users are active today says nothing about whether the app is retaining the people it already has. Cohort retention answers a different, more useful question: of everyone who installed the app in a given week, what share is still opening it a month later? A business that keeps acquiring new users while losing existing ones at a high rate can still show growing total user counts while quietly building an app nobody keeps using — a pattern only cohort retention analysis reveals clearly.
What This Approach Doesn’t Cover
In-app behavioural analytics can’t tell a marketing team which advertising channel, social post, or app-store search term actually brought a given user to install the app in the first place — that’s a separate measurement problem, covered by campaign-level mobile marketing analytics. It also depends entirely on the app’s own event tracking being set up correctly; a screen or action that was never instrumented to log an event is invisible to the analytics tool no matter how many users interact with it.
Getting the Instrumentation Right First
Every one of these metrics depends on the app actually logging the right events, and this is where many teams lose value before the analytics tool ever gets a chance to help. Deciding what counts as a meaningful event — a screen view, a specific button tap, a completed purchase — needs to happen before launch, because retrofitting tracking onto an app that’s already live means losing historical data for anything that wasn’t originally instrumented. A team that tracks only page views and ignores the specific actions users take on each page ends up with plenty of data and very little insight, since knowing someone visited a screen says nothing about whether they did anything useful once they got there.
Summary
Mobile app analytics measures in-app user behaviour: how often and how long people use an app (Böhmer et al., 2011), where they drop out of a defined sequence of steps, and what share of new users are still active weeks later. The funnel view and cohort retention view both go beyond a single average number to show specifically where a marketing or product team should focus its next fix. This in-app view is deliberately separate from measuring which marketing channel or campaign drove the original install, which is the focus of mobile marketing analytics at the campaign level.
The slides, worksheet, lesson plan and poster for this lesson are free to download and free to use in your course — no sign-up, no permission needed. See the teacher resources →
Assign this lesson to your class:
Using Canvas, Blackboard or Moodle? Copy the link and paste it into your course page or assignment. More ways to add lessons to your LMS.

