
Learning outcome
What Is the S3M Framework?
Social media platforms generate an enormous amount of measurable data — likes, shares, comments, mentions, sentiment, click-throughs — and a whole industry of tools, reports, and academic studies exists to make sense of it (Kaplan & Haenlein, 2010). The trouble is that “social media analytics” is not one single activity. A study that counts Twitter mentions during a product launch is answering a completely different question from a report that tracks Instagram engagement rates over a year, even though both would happily be filed under the same broad label. Misirlis and Vlachopoulou (2018) reviewed 52 peer-reviewed studies on social media metrics and analytics in marketing and found exactly this problem: work in the field was scattered across so many different approaches that comparing one study to another was often meaningless. Their solution was S3M, a five-dimension classification scheme that sorts any piece of social media analytics work by what it actually measures, how, and why.
The Five S3M Dimensions
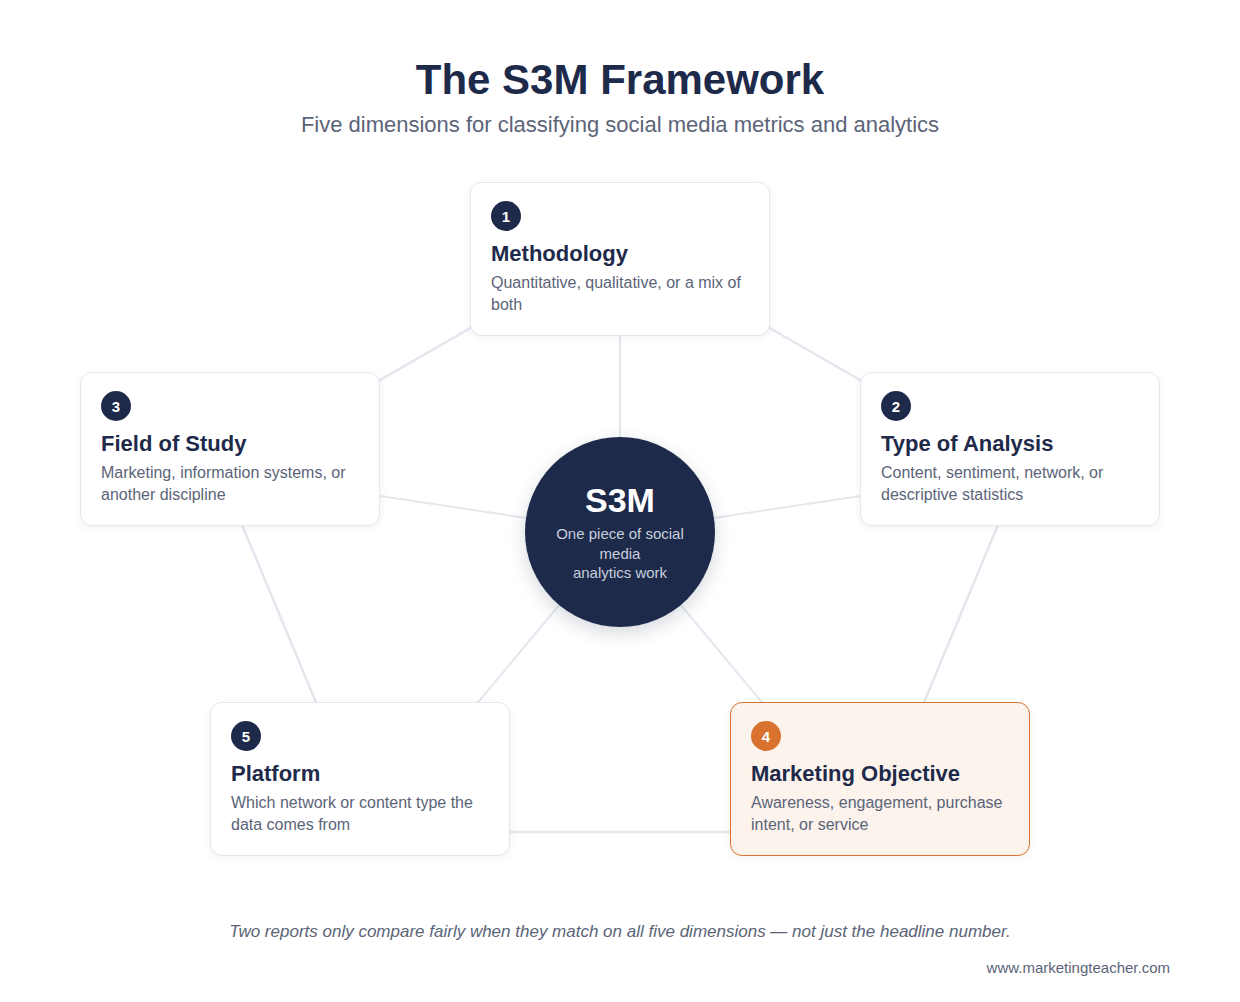
S3M classifies social media metrics and analytics work along five dimensions (Misirlis & Vlachopoulou, 2018). The first is methodology of research — whether the work is quantitative (counting and calculating), qualitative (interpreting meaning and context), or a mix of both. The second is type of analysis — the specific technique used, such as content analysis, sentiment analysis, network analysis, or straightforward descriptive statistics. The third is field of study — the discipline the work sits in, whether that’s marketing, information systems, computer science, or communications, since each field tends to ask different questions of the same data. The fourth is marketing objective — the actual business goal being measured, such as brand awareness, customer engagement, purchase intent, or customer service quality. The fifth is social media platform — which network or content type the data comes from, since a metric that works well on a visual platform like Instagram can be meaningless on a text-based one like a discussion forum.
None of these five dimensions is more “correct” than another — they simply describe different choices a piece of analytics work has already made before a single number gets reported. Two studies can both be perfectly rigorous and still be impossible to compare, because they were never measuring the same thing in the same way for the same reason.
Example: Classifying an Instagram Engagement Report
Why the Same Word Can Mean Different Things
This matters because marketers routinely benchmark their own results against a competitor’s, an industry average, or last year’s figures, and social media metrics travel easily between contexts that do not actually match. An “engagement rate” calculated from a quantitative count of likes and comments is not the same measurement as an “engagement” score derived from a qualitative reading of comment sentiment, even though both reports might use the word “engagement” in their headline figure. Comparing them side by side, without first checking whether they share a methodology, type of analysis, and objective, produces a conclusion that only looks precise. Misirlis and Vlachopoulou (2018) found this kind of mismatch running through a large share of the published research they reviewed, which is exactly why they built S3M as a shared vocabulary rather than another single metric to add to the pile.
Using S3M Before You Trust a Number
The practical use of S3M is as a checklist to run through before commissioning, buying, or believing a piece of social media analytics work. Before asking for a report, a marketer should first decide which platform actually matters for the question at hand, whether the objective is awareness, engagement, purchase intent, or service quality, and whether a quantitative count, a qualitative read, or a mix of both will actually answer it. Getting that order right — deciding the objective and platform before choosing a method — stops a business from buying an off-the-shelf analytics package simply because it is easy to install, only to discover afterwards that it measures a platform or objective nobody actually needed tracked.
Applied afterwards, the same five dimensions work as a quick audit of a report that has already landed on a desk. If a supplier cannot say plainly which platform, objective, methodology, and type of analysis their numbers relate to, the figures are much harder to act on with any confidence, however polished the report looks. This is also a useful habit when reading published research or industry benchmarks: a headline statistic lifted from a study with a different objective or platform is not a fair comparison, even when both are described, in general terms, as “social media analytics.”
Summary
The S3M framework classifies social media metrics and analytics work along five dimensions: methodology of research, type of analysis, field of study, marketing objective, and social media platform (Misirlis & Vlachopoulou, 2018). Two reports that both call themselves “social media analytics” can still be answering entirely different questions, so checking that a comparison actually holds across all five dimensions — not just skimming the headline number — is what separates a genuinely useful insight from a coincidence of vocabulary.
The slides, worksheet, lesson plan and poster for this lesson are free to download and free to use in your course — no sign-up, no permission needed.

