
What Is the DATA Framework?
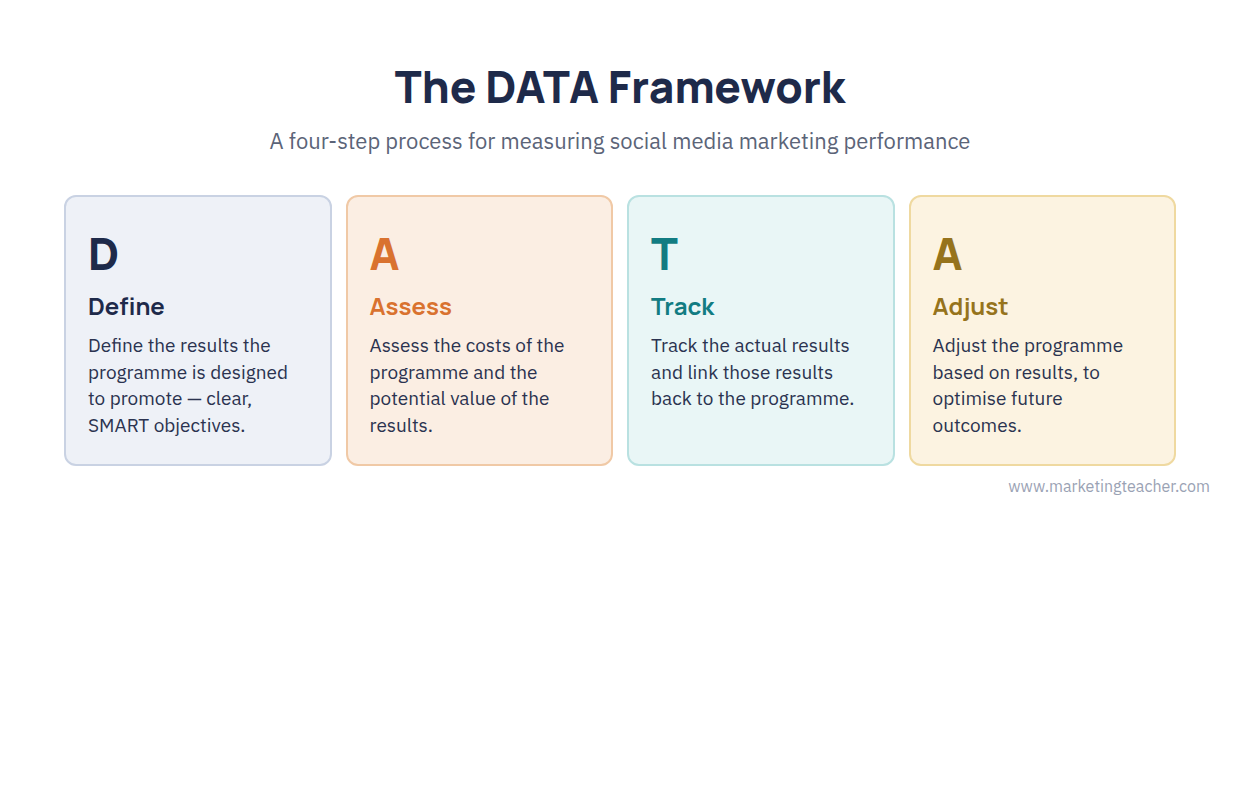
Tuten and Solomon (2018) argue that measurement isn’t optional in social media marketing: sooner or later, every campaign has to answer to the people holding the budget. They organise the measurement process into a four-step approach they call DATA: Define the results the programme is designed to produce, Assess the costs and potential value of those results, Track the actual results as they happen, and Adjust the programme based on what the data show. It’s a deliberately simple structure, but each step involves real decisions about what to measure and how to interpret it. Social media measurement is also a genuinely young discipline: Murdough (2009) compared it to where web analytics stood back in the mid-1990s, still evolving as marketers experiment and enterprise measurement tools mature.
Define: Setting SMART Objectives
The first and, arguably, most important step is defining exactly what the campaign is meant to achieve. Tuten and Solomon (2018) recommend objectives with SMART characteristics: Specific, Measurable, Appropriate, Realistic, and Time-oriented. Compare “we will tell everyone about our new Facebook page and see if they like it enough to buy more” with “we will promote our Facebook page through display ads on three named websites, and on July 15 we will count new page likes and compare sales to the same period last year.” Only the second version gives anyone something concrete to check. Vague ambitions such as “create buzz” have to be translated into something countable, whether that’s a jump in site traffic, an improvement in search ranking, or growth in impressions relative to what traditional media would have cost for the same reach.
Three Types of Metrics: Activity, Interaction, and Return
Once objectives are defined, Tuten and Solomon (2018) group the metrics available to track them into three types. Activity metrics capture what the organisation itself does — impressions, clickthroughs, and time spent with content — and are useful for comparing tactics against each other. Interaction metrics capture how the audience engages: followers, comments, likes, reviews, and shared content. Return metrics capture the outcomes that ultimately matter to the business, financial or otherwise, including return on investment. When ROI is calculated specifically for social media activity, Tuten and Solomon (2018) call it social media return on investment (SMROI): how much income did the investment in social media actually generate? Several models exist for estimating it, from valuing impressions directly to using an advertising-equivalency value that asks what an equivalent amount of paid exposure would have cost.
Track: Building a Measurement Ecosystem
Tracking means collecting and organising the data needed to judge results, and Tuten and Solomon (2018) point to four main sources: owned-site analytics such as Google Analytics, each social network’s own analytics (Facebook Insights, Twitter Analytics, and the like), enterprise social listening and analytics platforms, and niche tools built for a specific job such as hashtag tracking. A performance dashboard pulls these sources together so a marketer isn’t checking half a dozen separate logins to see how a campaign is doing. One caution worth building into any tracking plan: a large share of social sharing happens through channels analytics simply can’t see. Tuten and Solomon (2018) describe this as “dark social” — content passed along by email, text, and private messaging apps rather than a platform’s own share button — and note research suggesting the large majority of social shares travel this invisible route. That matters because a channel can look like it’s underperforming in the dashboard when, in fact, its content is being shared enthusiastically just not where the tracking code can follow it.
Adjust: Closing the Loop
The final step is the one measurement only matters if you actually do: using what Assess and Track revealed to change future strategy and tactics. Tuten and Solomon (2018) frame this as the whole point of the exercise — a KPI that never feeds back into a decision is just a number on a dashboard. Marketers who want a simple starting point before building a full measurement programme can begin with a handful of questions: who is consuming the content, who is adding to it, at what rate people are sharing it, and whether the audience actually growing around the brand is the one the campaign was meant to reach.
Summary
The DATA framework organises social media measurement into four steps — Define, Assess, Track, and Adjust — built around SMART objectives and three types of metrics: activity, interaction, and return. Real assessment, like the one-word A/B test that lifted a campaign’s conversion rate, comes from testing design choices against KPIs, while tracking has to account for blind spots such as dark social that can make a channel look weaker than it really is (Tuten & Solomon, 2018).

