
By the end of this lesson you will be able to explain what web analytics is, describe the three levels of metrics most businesses track on their website, and explain why a highly trafficked website does not automatically mean a business is winning.
What Is Web Analytics?
Every visit to a website leaves a trail: where the visitor came from, what they clicked, how long they stayed, and whether they eventually did anything the business actually wanted them to do. Web analytics is the practice of collecting that trail of data, analysing it, and reporting it in a way that helps a business understand and improve how its website is used (Järvinen & Karjaluoto, 2015). It has become one of the most widely adopted marketing tools around, in large part because the core tools that collect this data can be installed on a website for free. That wide adoption is a little deceptive, though: having the data is not the same as using it well, and plenty of businesses collect huge amounts of website data without ever connecting it back to a real marketing goal.
Three Levels of Web Analytics Metrics
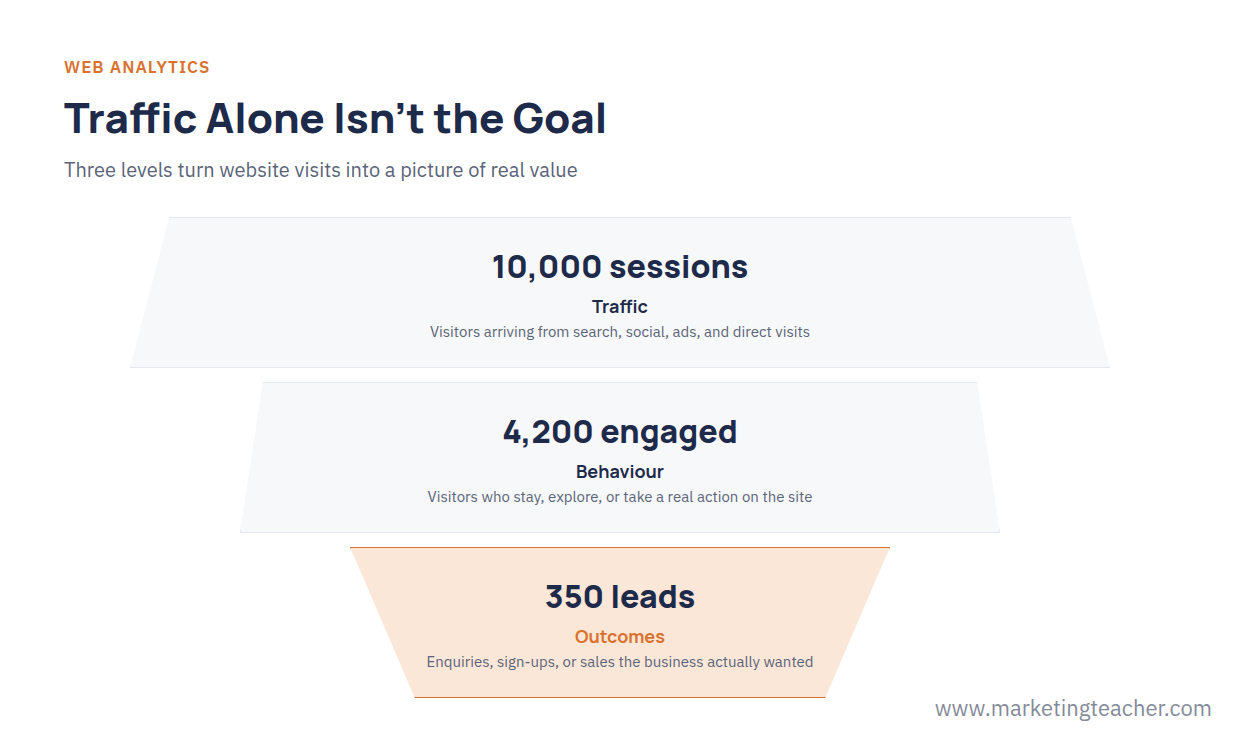
A useful way to organise web analytics data is to think of it in three levels, each answering a different question about a visitor’s journey (Järvinen & Karjaluoto, 2015).
The first level is traffic generation: how many people are arriving at the website, and where are they coming from? This includes visits driven by organic search, paid search ads, social media, email campaigns, and people typing the address in directly. This level tells a business whether its efforts to attract visitors in the first place are working.
The second level is on-site behaviour: once visitors arrive, what do they actually do? This covers how many pages they view, how long they stay, which pages they land on and leave from, and whether they interact with the site in any meaningful way rather than glancing and leaving. This level tells a business whether the website itself is holding people’s attention.
The third level is outcomes: did the visit actually lead anywhere valuable? This is where a business tracks the things that matter to its bottom line, such as completed purchases, form submissions, phone calls, or qualified sales leads, and ideally ties those outcomes back to the specific channel or campaign that produced them. This is the level that connects a website’s traffic to real business results, and it is also the level most businesses find hardest to build well.
From Vanity Metrics to Meaningful Ones
It is tempting to track everything a web analytics tool can measure, simply because the data is there and it is free to collect. In practice, that habit tends to produce a flood of numbers without a clear sense of which ones matter. A more useful approach is to start by deciding what the business is actually trying to achieve with its digital marketing, whether that is more sales enquiries, more newsletter sign-ups, or more repeat visits, and then choose a small set of key performance indicators that directly reflect progress toward that goal. Everything else becomes supporting detail rather than the main event. Businesses that skip this step often end up able to say how many people visited their site, but unable to say whether that traffic is actually worth anything.
A small design studio tracks its website for a month and records 10,000 sessions arriving from a mix of organic search, social media, and paid ads. Of those sessions, 4,200 count as genuinely engaged, meaning the visitor stayed for a meaningful amount of time, viewed more than one page, or took some direct action on the site. Of those engaged visitors, 350 fill out the studio’s project enquiry form, and of those enquiries, 60 go on to become paying clients. Looked at on its own, the 10,000-session figure sounds impressive. Looked at as a funnel, it tells a sharper story: less than half of visitors are genuinely engaging with the site, and only a small fraction of engaged visitors convert into an enquiry. That funnel view points the studio toward two very different fixes, improving what happens after someone lands on the page rather than simply chasing more traffic, and tightening the follow-up process for the leads it already has.
What Counts as an "Engaged" Visit?
Not all website visits are equal, and modern web analytics tools try to separate visits that reflect genuine interest from visits that do not. A session is typically counted as engaged when it clears at least one of a few simple thresholds: it lasts longer than a short baseline amount of time, it includes some specific action the business cares about, or the visitor looks at more than one page. A session that fails all of those tests is usually labelled a bounce, and the bounce rate, the share of sessions that were not engaged, is one of the most commonly quoted (and most commonly misread) figures in web analytics. A high bounce rate is not automatically bad; a visitor who lands on a page, gets the phone number they needed, and leaves within seconds has still had a perfectly successful visit. The figure is only useful once it is read alongside what a particular page is supposed to do for a visitor.
Tools such as Google Analytics remain the most common way businesses collect this kind of data, largely because a capable version is free to use, but the same underlying ideas, sessions, engagement, and outcomes, apply whichever platform is doing the measuring.
Summary
Web analytics is the collection and analysis of website data to understand how a site is being used and whether it is delivering real value. Rather than treating all metrics as equally important, it helps to think in three levels: how many visitors arrive, how they behave once they get there, and what outcomes those visits actually produce. A large number of visits means very little on its own; what matters is how many of those visits are genuinely engaged, and how many engaged visits turn into the kind of outcome the business actually set out to achieve.
Quiz

The slides, worksheet, lesson plan and poster for this lesson are free to download and free to use in your course — no sign-up, no permission needed.

