
What Is Social Media Testing and Tracking?
Two sources give us useful starting points. Kohavi, Tang and Xu (2020) describe online controlled experiments, or A/B tests, as a way of applying the scientific method to digital decisions: you form a hypothesis, show different versions to randomly chosen groups, and judge the result against a clear, agreed success measure. Hoffman and Fodor (2010) take a different angle on tracking. They argue that many managers measure social media return on investment backwards, starting with their own spending; instead, they should start with why consumers use social media and measure the investments consumers make, such as time, attention and sharing, when they engage with a brand.
The first definition is about method: how to find out, fairly, whether one option works better than another. The second is about meaning: what we should be measuring in the first place. Testing tells you which version wins; tracking tells you what that win was worth.
Tuten (2024) groups analytics and metrics together as the data and measurement stage of social media marketing, and the DATA Framework lesson shows how to set objectives and choose metrics. This lesson covers the practical tools that sit underneath that framework.
A/B and Multivariate Testing
An A/B test compares two versions of one thing, such as two headlines, two images or two calls to action, while everything else stays the same. The audience is split at random, so any difference in results is likely to be caused by the change rather than by chance or timing. Major social ad platforms, such as Meta Ads Manager, offer built-in A/B testing tools that handle the random split for you.
A multivariate test changes several elements at once (for example, three images × two headlines = six combinations) to see which combination performs best. It can reveal how elements work together, but it needs far more traffic, because the audience is split into many small groups.
Good tests follow a few simple rules:
- Test one idea at a time in an A/B test, and write the hypothesis down first (“A lifestyle photo will get a higher click-through rate than a product-only photo”).
- Agree the success metric before you start, such as click-through rate, cost per sale or sign-ups.
- Run the test long enough to collect a meaningful sample and to cover different days of the week.
- Do not stop early just because one version is ahead after a few hours. Early leads often disappear.
Kohavi, Tang and Xu (2020) sum up the challenge well: “Getting numbers is easy; getting numbers you can trust is hard.”
Tracking: UTM Parameters, Pixels and Conversions
UTM parameters are short tags added to the end of a link so that web analytics tools such as Google Analytics can see where a visitor came from. Google advises always using three of them (Google, n.d.):
| Parameter | Tells you | Example |
|---|---|---|
| `utm_source` | Where the traffic came from | `instagram` |
| `utm_medium` | The type of marketing | `paid_social` |
| `utm_campaign` | The campaign or promotion | `autumn_throws` |
`utm_content` is optional and is used to tell creative versions apart, which makes it ideal for A/B tests. A complete link looks like this:
`harborandthread.co.uk/throws?utm_source=instagram&utm_medium=paid_social&utm_campaign=autumn_throws&utm_content=lifestyle_photo`
Keep a shared spreadsheet of naming rules (all lower case, underscores, no spaces) so that “Instagram”, “instagram” and “IG” do not appear as three separate sources in reports.
A tracking pixel is a small piece of code placed on a website by a social platform, such as the Meta Pixel or the LinkedIn Insight Tag. It reports actions such as “added to basket” or “purchase” back to the platform, so the platform can count conversions, build retargeting audiences and optimise ad delivery. Many platforms also offer server-side tracking, where the website’s server sends conversion data directly to the platform.
In the UK, pixels that store or access information on a user’s device fall under the Privacy and Electronic Communications Regulations, so consent is normally needed before advertising pixels fire (ICO, 2026). See UK GDPR and Marketing Compliance for more detail.
Attribution Basics
Most customers see a brand several times before buying: perhaps a TikTok video, then a Google search, then an email. Attribution is the set of rules that decides which touchpoints get credit for the sale.
- Last click gives all the credit to the final channel before purchase. It is simple but undervalues social media, which often works earlier in the journey.
- Data-driven attribution uses the account’s own data to share credit across all the channels that contributed. Google Analytics now offers data-driven and last-click models for key events (Google, n.d.).
No model is perfect. Social platforms also report their own conversions, and these totals rarely match Google Analytics because each tool counts differently. Choose one “source of truth” for decisions and use the others as a cross-check.
Social Media ROI and the Optimisation Cycle
Return on investment compares what you gained with what you spent:
ROI (%) = (Value gained − Cost) ÷ Cost × 100
Cost should include staff time, tools and content production, not just ad spend. Value may be sales, but Hoffman and Fodor (2010) remind us that some returns are longer term, such as lower customer-service costs when questions are answered in a community.
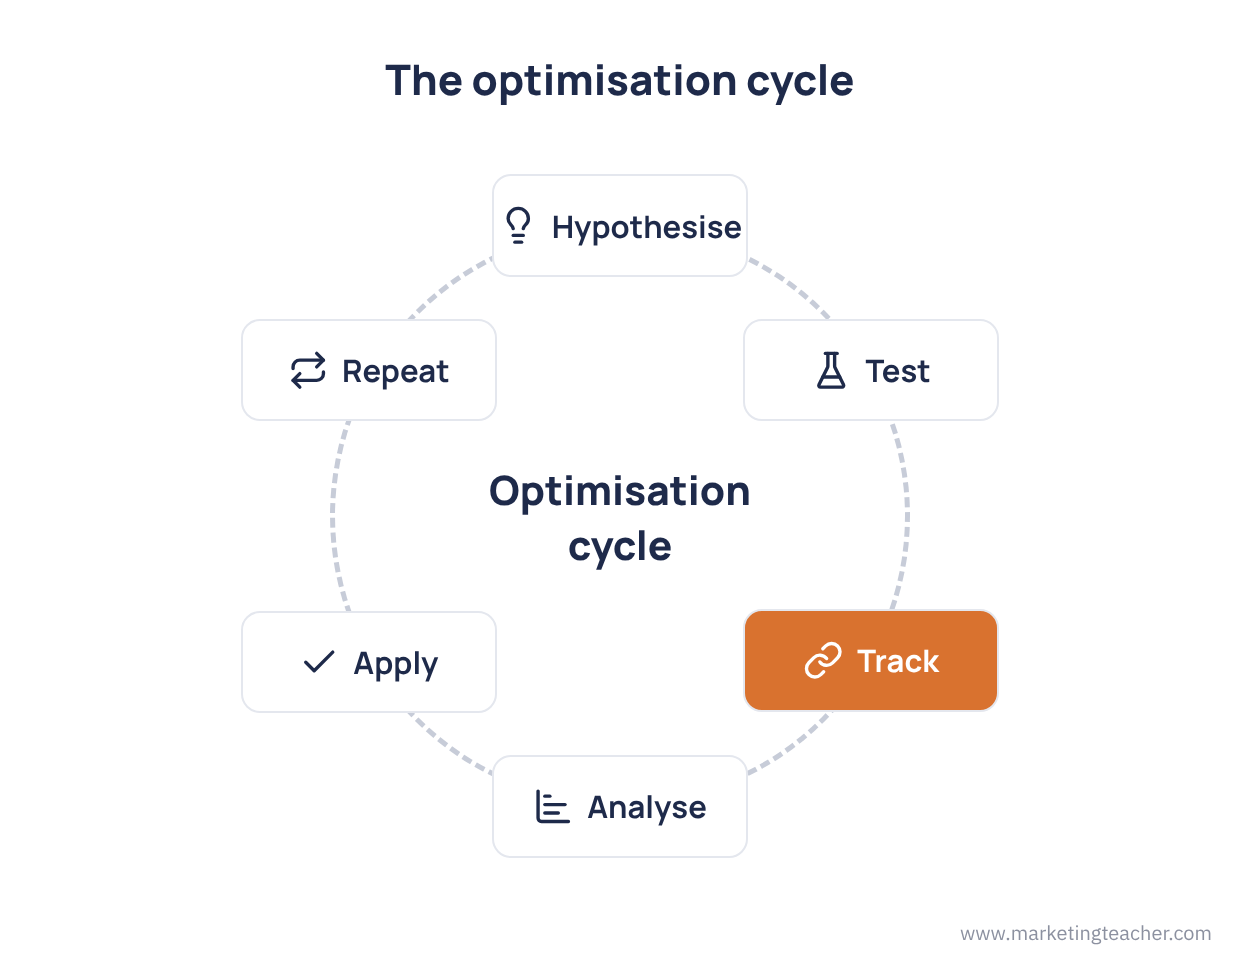
Optimisation is a cycle, not a one-off task: Hypothesise → Test → Track → Analyse → Apply → repeat. Each winning version becomes the new “control” to beat.
Summary
Testing and tracking turn social media from guesswork into evidence. A/B tests compare one change at a time; multivariate tests compare combinations but need more traffic (Kohavi, Tang & Xu, 2020). UTM parameters show where web visitors came from, pixels record conversions (with consent in the UK), and attribution models share credit across touchpoints. ROI should count all costs and, as Hoffman and Fodor (2010) argue, consider value from the customer’s side. Optimisation is a repeating cycle of testing, tracking and improving.
The slides, worksheet, lesson plan and poster for this lesson are free to download and free to use in your course — no sign-up, no permission needed. See the teacher resources →
Assign this lesson to your class:
Using Canvas, Blackboard or Moodle? Copy the link and paste it into your course page or assignment. More ways to add lessons to your LMS.

