What Are the Seven Layers of Social Media Analytics?
Social media analytics is the art and science of extracting valuable insights from the vast amounts of semi-structured and unstructured data that social media produces, in order to support informed business decisions (Sponder & Khan, 2017). It is a science because it depends on systematically identifying, extracting, and analysing social media data using a range of tools and techniques. It is also an art, because those insights only become genuinely useful once analysts and business owners connect them to real business goals rather than treating them as numbers for their own sake.
Businesses draw on social media analytics for a wide range of purposes: measuring brand loyalty, generating leads, driving traffic to owned platforms such as a company website or app, forecasting future demand, building a picture of an audience’s demographics and interests, and supporting broader market research and decision-making.
To make sense of such a wide field, analysts commonly break social media data down into seven distinct layers, each capturing a different kind of signal buried inside the same stream of posts, likes, links, and locations (Sponder & Khan, 2017).
The Seven Layers of Social Media Data
The first layer is Text: the actual content people post, including comments, tweets, blog posts, and status updates. This is the layer most people think of first, and it’s the raw material behind sentiment analysis and trend spotting.
The second is Networks: the personal and professional connections between users on platforms such as Facebook, LinkedIn, and Twitter. Mapping a network shows who influences whom, and how information actually spreads.
The third is Actions: what users do rather than what they say, including likes, shares, mentions, and endorsements. Actions are often easier to measure at scale than text, but they say less about why someone acted.
The fourth is Hyperlinks: the in-links and out-links that connect social content to the wider web. A page that’s frequently linked to tends to carry more weight, both with audiences and with search engines.
The fifth is Mobile: engagement measured specifically through mobile apps, reflecting how much of social activity now happens on a phone rather than a desktop browser.
The sixth is Location: geospatial data showing where users, content, and activity are physically situated, useful for anything from regional campaign targeting to store visit analysis.
The seventh is Search engines: how search engines rank and surface social content, which shapes how easily a business’s social presence gets discovered in the first place.
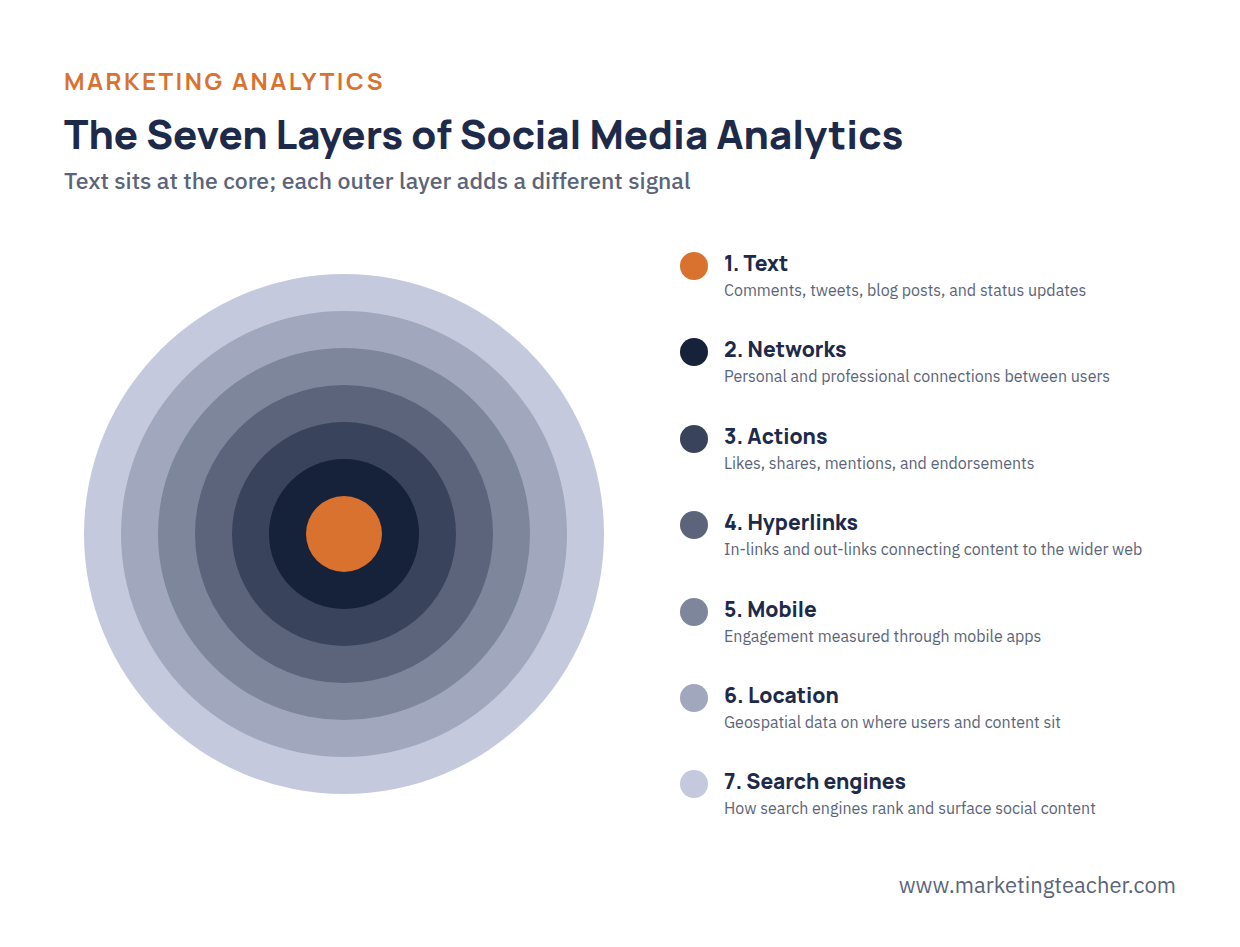
No single layer tells the whole story on its own. A business trying to understand a product launch, for example, might combine Text (what people are saying), Networks (who’s saying it and how far it spreads), and Actions (whether people are actually sharing or just scrolling past) before drawing any conclusions.
Turning Data Into Decisions: Three Types of Analytics
Once the seven layers have been captured, businesses apply one of three broad types of analysis to them.
Descriptive analytics focuses on gathering and describing social media data through reports, visualisations, and clustering, in order to understand a business problem as it currently stands. Counting likes, tweets, and views, or grouping comments into themes to understand overall sentiment, are both examples of descriptive analytics. It currently accounts for the majority of social media analytics work, simply because it’s the necessary first step before anything more advanced.
Predictive analytics goes further, analysing large amounts of accumulated data to anticipate a future event. An intention expressed on social media, such as wanting to buy, sell, or switch to a competitor, can be mined to predict what a customer is likely to do next. Past visits to a website can similarly be used to forecast future sales figures.
Prescriptive analytics goes further still. Where predictive analytics forecasts what’s likely to happen, prescriptive analytics recommends the best action to take in response.
The Challenges of Working With Social Media Data
Even with the seven layers mapped out and the right type of analysis chosen, social media analytics comes with real practical challenges.
Data volume and velocity is the first: social media data is enormous and generated at speed, with millions of new records appearing every second. Capturing and analysing all of it isn’t realistic, so knowing what to focus on becomes as important as the analysis itself.
Data diversity is the second: social media users and the content they produce are extremely varied, multilingual, and inconsistent across time and place. Not every post is equally worth analysing; a mention from an influential user typically carries far more weight than one from an account nobody follows.
Unstructured data is the third: unlike the tidy, numerical data stored in a typical corporate database, social media data is largely unstructured, made up of text, images, actions, and relationships that don’t fit neatly into rows and columns.
Summary
Social media analytics is both a science and an art: the systematic extraction of insight from social data, combined with the judgement needed to connect that insight to real business goals. That data can be broken into seven layers, Text, Networks, Actions, Hyperlinks, Mobile, Location, and Search engines, each revealing a different part of the picture (Sponder & Khan, 2017). Businesses apply descriptive, predictive, or prescriptive analytics to that data depending on whether they want to understand the present, forecast the future, or decide what to do next, while working around the real challenges of volume, diversity, and unstructured data that come with the territory.