
What Is Meta (Facebook) Marketing Analytics?
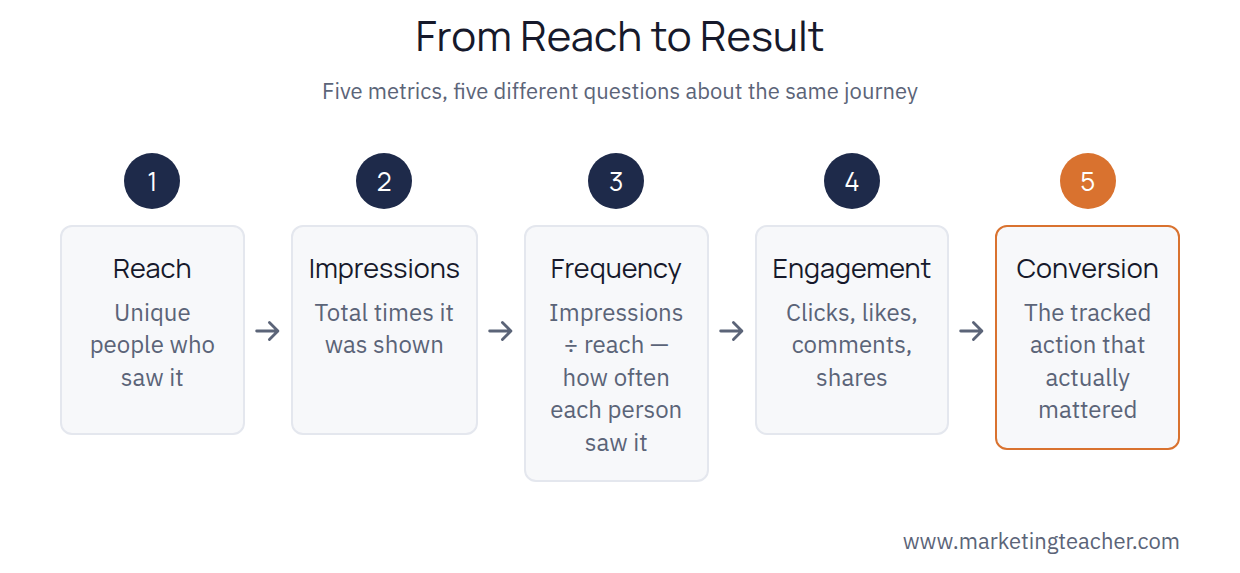
Meta (Facebook) marketing analytics is the measurement and interpretation of how people respond to a business’s activity on Facebook and Instagram — organic posts and paid ads alike — using the data Meta’s own tools collect. Kotler and Armstrong (2018) describe the broader shift this sits inside: engagement marketing succeeds only when a brand can see whether its social media activity is actually reaching and moving its target audience, not just posting into the void. Analytics is what turns “we posted something” into “here is what happened because we posted it.”
The Core Metrics, and Why They’re Not Interchangeable
Meta’s own Business Help Center draws a specific distinction that trips up a lot of new marketers: reach is the number of unique people who saw a post or ad, while impressions is the total number of times it was shown, which can be higher than reach because the same person can see it more than once (Meta Business Help Center, 2026). Frequency — impressions divided by reach — tells a marketer how many times, on average, each person has already seen the message; a high frequency on a low-reach campaign is often a sign to refresh the creative or expand the audience rather than keep spending. None of these three numbers alone tells the whole story, which is why Meta’s reporting shows them together rather than as a single combined score.
Beyond Awareness: Engagement and Conversion
Reach and impressions describe how many people saw something; engagement and conversion describe what they did about it. Engagement metrics — likes, comments, shares, saves, click-through rate — show whether the content itself was interesting enough to act on, and Tuten and Solomon (2017) frame this as the layer that separates a merely visible campaign from one that’s actually building a relationship with an audience. Conversion metrics go a step further, tracking the specific action a business actually cares about: a completed purchase, a lead form, an app install. A post can have excellent engagement and still convert poorly if the audience clicking and commenting isn’t the audience that buys.
How Meta Tracks a Conversion After Someone Leaves the App
The hardest part of this measurement chain is connecting an ad seen on Facebook to something that happens later, on a business’s own website. Meta’s own documentation on this problem describes two connected tools: the Meta Pixel, a small piece of code placed on a website that reports back when a visitor who came from an ad completes an action, and the Conversions API, which sends that same event data directly from a business’s own servers rather than relying solely on the visitor’s browser (Meta Business Help Center, 2026). Together they’re what make it possible to say a specific ad actually led to a specific sale, rather than just a specific click.
Reading the Numbers as a Set, Not One at a Time
The practical skill in Meta marketing analytics is less about knowing what each metric means individually and more about reading them together to diagnose a specific problem. Strong reach with weak engagement usually points to a targeting or content-relevance problem. Strong engagement with weak conversion usually points to a mismatch between the audience clicking and the audience that actually buys, or friction somewhere after the click. High frequency with flat results usually means the same people are seeing the same message too often, and it’s time to refresh it. Treating the dashboard as a diagnostic tool, rather than a single pass/fail score, is what separates analytics that actually improves a campaign from analytics that just documents it.
Summary
Meta (Facebook) marketing analytics measures how an audience responds to a business’s organic and paid activity on Facebook and Instagram, using metrics that track distinct stages of the same journey: reach and impressions measure visibility, frequency measures repetition, engagement measures interest, and conversion — tracked through tools like the Meta Pixel and Conversions API — measures whether the activity actually produced the outcome the business cares about. The skill lies in reading these metrics as a connected set: a weak result at any one stage points to a different fix than a weak result at another, which is what turns a dashboard full of numbers into a genuine diagnostic tool for improving a campaign.
The slides, worksheet, lesson plan and poster for this lesson are free to download and free to use in your course — no sign-up, no permission needed. See the teacher resources →
Assign this lesson to your class:
Using Canvas, Blackboard or Moodle? Copy the link and paste it into your course page or assignment. More ways to add lessons to your LMS.

