
What Is a Profit and Loss Statement?
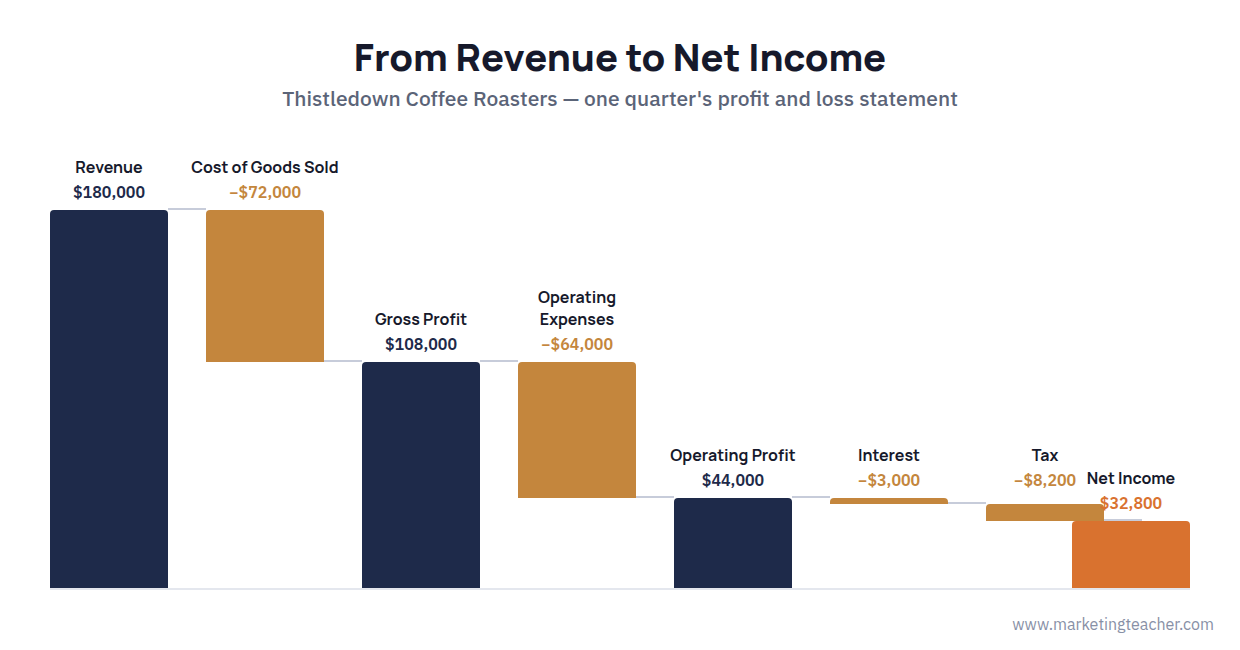
A profit and loss statement, often shortened to P&L and also called an income statement, summarises a business’s revenues, expenses and resulting profit or loss over a set period, typically a month, a quarter or a year. Atrill and McLaney (2019) describe it as one of the three core financial statements a business produces, alongside the balance sheet and the cash flow statement, and the one most directly concerned with a simple question: did the business make money during this period, and how much? Marketers do not need to prepare a P&L themselves, but reading one competently matters, since it is usually the document a manager reaches for when asked to justify a budget or defend a campaign’s contribution to the business.
From Revenue to Gross Profit
A P&L is read top to bottom, and every figure below the top line is a subtraction. It starts with revenue, sometimes called net sales, which is income from all completed sales after removing the value of any returns or discounts. From revenue, the statement subtracts the cost of goods sold, the direct cost of producing or acquiring whatever was sold, such as raw materials, manufacturing costs, or the wholesale price paid for stock a retailer resells. Revenue minus the cost of goods sold gives gross profit, a figure that shows how much a business retains from each sale before any of its wider running costs, such as rent, marketing or admin staff, are taken into account at all.
Operating Expenses and Operating Profit
Below gross profit, a P&L lists operating expenses, everything a business spends running itself day to day that is not directly tied to producing what it sells: rent, salaries, marketing, insurance, depreciation of equipment, and general administration. Subtracting these from gross profit gives operating profit, often called EBIT, short for earnings before interest and tax. Operating profit is a particularly useful figure for comparing two periods, or two businesses of a similar size, because it strips out financing decisions and tax rates that vary for reasons that have nothing to do with how well the core business is actually being run.
Below the Operating Line: Interest, Tax and Net Income
The remaining steps deal with items outside day-to-day trading. Interest paid on any loans or overdrafts is subtracted next, followed by corporation tax, calculated on whatever profit remains once interest has been deducted. What is left after both is net income, commonly called the bottom line, the single figure a business owner, a bank or an investor usually looks at first. Net is the operative word: a business can post strong revenue and still end a period with a thin, or even negative, net income if its costs at any stage of the statement have grown faster than its sales.
Why This Matters Beyond the Finance Team
A P&L is also where the return a marketing activity generates gets tested against what it cost, which is exactly the comparison return on investment is built to make at a campaign level. A marketing budget that shows up as an operating expense has to earn its place by contributing to revenue or gross profit growth that more than covers it, and a manager who can speak fluently about where a campaign’s cost sits on the P&L, and what it is expected to move further up the statement, tends to get a very different hearing in a budget meeting than one who cannot. This is also why comparing a P&L across several periods matters more than reading any single one in isolation: a single quarter’s net income says relatively little on its own, but a steady rise or fall across four or five consecutive statements usually reveals whether a genuine trend is underway, or whether one unusual quarter was simply an outlier.
Summary
A profit and loss statement moves in a fixed sequence: revenue, minus the cost of goods sold, gives gross profit; minus operating expenses gives operating profit; minus interest and tax gives net income (Atrill & McLaney, 2019). Each subtraction isolates a different question about how a business is performing, from how efficiently it produces what it sells through to how well it is managed overall once every cost is accounted for. Reading a P&L at each of these stages, rather than only at the bottom line, is what turns it from an accountant’s document into a genuinely useful tool for anyone making decisions about where a business spends its money.
The slides, worksheet, lesson plan and poster for this lesson are free to download and free to use in your course — no sign-up, no permission needed. See the teacher resources →
Assign this lesson to your class:
Using Canvas, Blackboard or Moodle? Copy the link and paste it into your course page or assignment. More ways to add lessons to your LMS.

