
What Is the Business Model Canvas?
A business model describes how an organisation creates, delivers and captures value: what it offers, who it offers it to, and how it makes money from doing so. The Business Model Canvas is a one-page tool for setting that out. Osterwalder and Pigneur (2010) developed it with 470 practitioners from 45 countries, and it has since become one of the most widely used tools for start-ups and established businesses alike.
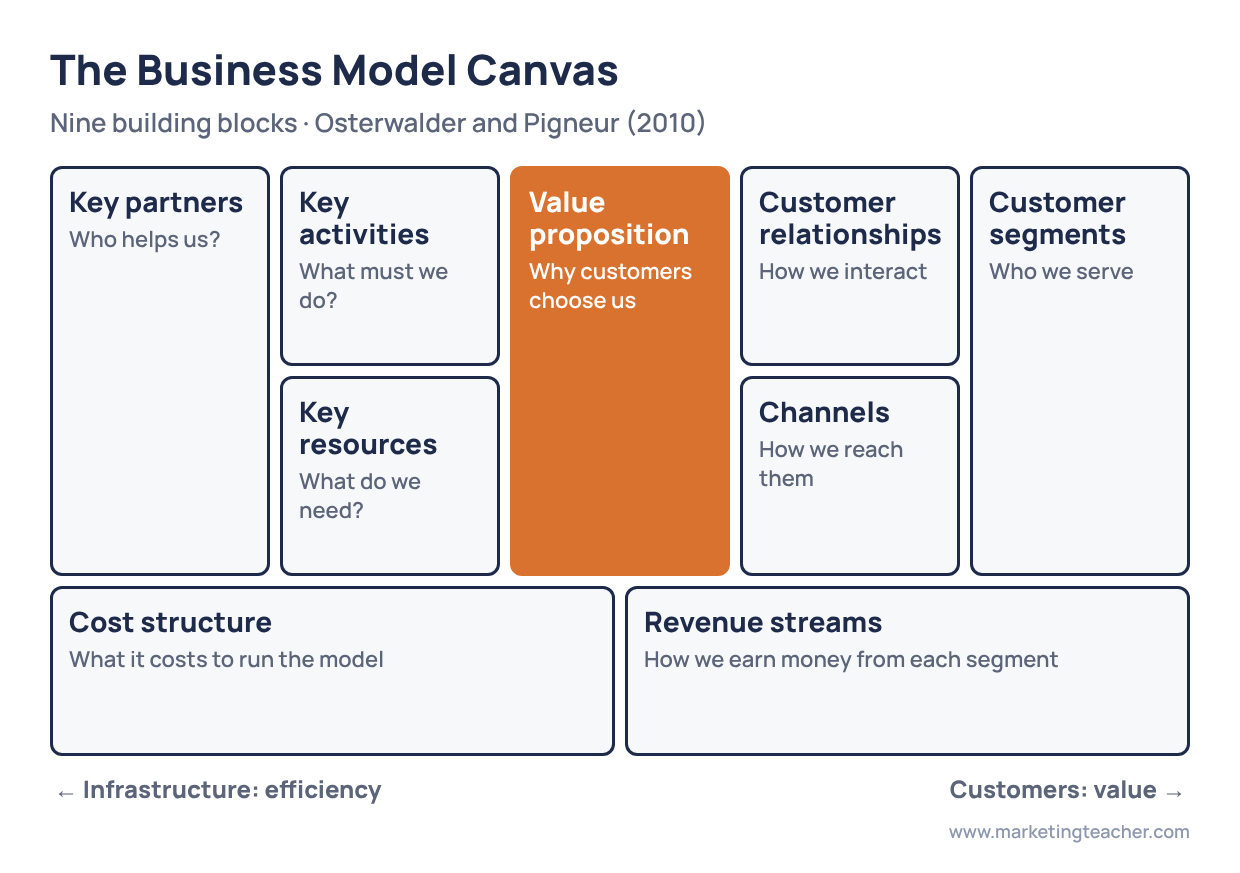
The canvas breaks any business model into nine building blocks. Because they all sit on a single sheet, a team can see at a glance how the parts depend on each other, and spot where a change in one block will affect the rest.
The Customer Side
The right-hand side of the canvas is about customers and value.
- Customer segments are the groups of people or organisations the business serves. Each may need a different offer, channel or relationship, which is why segmentation and targeting come first.
- Value proposition is the bundle of products and services that solves a problem or meets a need for a segment. It is the reason customers choose this business over another.
- Channels are how the business reaches customers and delivers the value proposition, from a shop or website to partners and resellers.
- Customer relationships describe the kind of relationship each segment expects, from self-service and automated help to a personal account manager or an online community.
- Revenue streams show how the business earns money from each segment, for example one-off sales, subscriptions, advertising, licensing or usage fees.
The Infrastructure Side
The left-hand side is about how the business delivers that value efficiently.
- Key resources are the most important assets the model needs: people, equipment, intellectual property, data or a brand.
- Key activities are the most important things the business must do well, such as making, selling, or running a platform. Value chain analysis is a useful way to identify them.
- Key partners are the suppliers and organisations the business relies on, often to reduce risk or gain resources it does not own.
- Cost structure lists the main costs of running the model, and whether it is driven by keeping costs low or by delivering premium value.
The Business Model Canvas and the Value Proposition Canvas
The Value Proposition Canvas was introduced later by Osterwalder et al. as a companion tool. It zooms in on just two blocks, customer segments and the value proposition, to check that an offer really fits what customers need. The Business Model Canvas zooms out to the whole business, to check that the offer can be delivered and make a profit. A sensible order is to use the Value Proposition Canvas to find fit, then the Business Model Canvas to build the business around it.
A close relative is the Lean Canvas, adapted from the Business Model Canvas by Maurya (2012) for start-ups. It swaps some infrastructure blocks for problem, solution, key metrics and unfair advantage, putting the focus on testing whether a new idea is worth pursuing at all.
Using the Canvas Well
The canvas is a summary, not a full plan. Chaffey and Ellis-Chadwick (2022) point out that it has no place for key performance indicators, and suggest adding measures to blocks such as revenue streams, cost structure and key activities so that the model can be tracked. Felin et al. (2020) go further, arguing that the canvas can encourage generic, incremental ideas unless a team uses it to build and test a distinctive theory of how its business will win.
In practice, the canvas works best when each block is treated as a set of assumptions to be checked with real customers and partners, and when it is redrawn as the business learns. Comparing the canvases of competitors can also show where a business could compete differently, for example through a long tail of niche products or a free tier paid for by another segment.
Summary
The Business Model Canvas, developed by Osterwalder and Pigneur (2010), summarises a business model in nine building blocks: customer segments, value proposition, channels, customer relationships and revenue streams on the customer side, and key resources, key activities, key partners and cost structure on the infrastructure side. It sits alongside the Value Proposition Canvas, which zooms in on customer fit, and the Lean Canvas, which adapts it for testing new ideas. Its strength is showing a whole business on one page; its limits are the lack of performance measures and the risk of filling it in from guesswork rather than evidence.
The slides, worksheet, lesson plan and poster for this lesson are free to download and free to use in your course — no sign-up, no permission needed.

