
What Are Financial Ratios and Why Do They Matter?
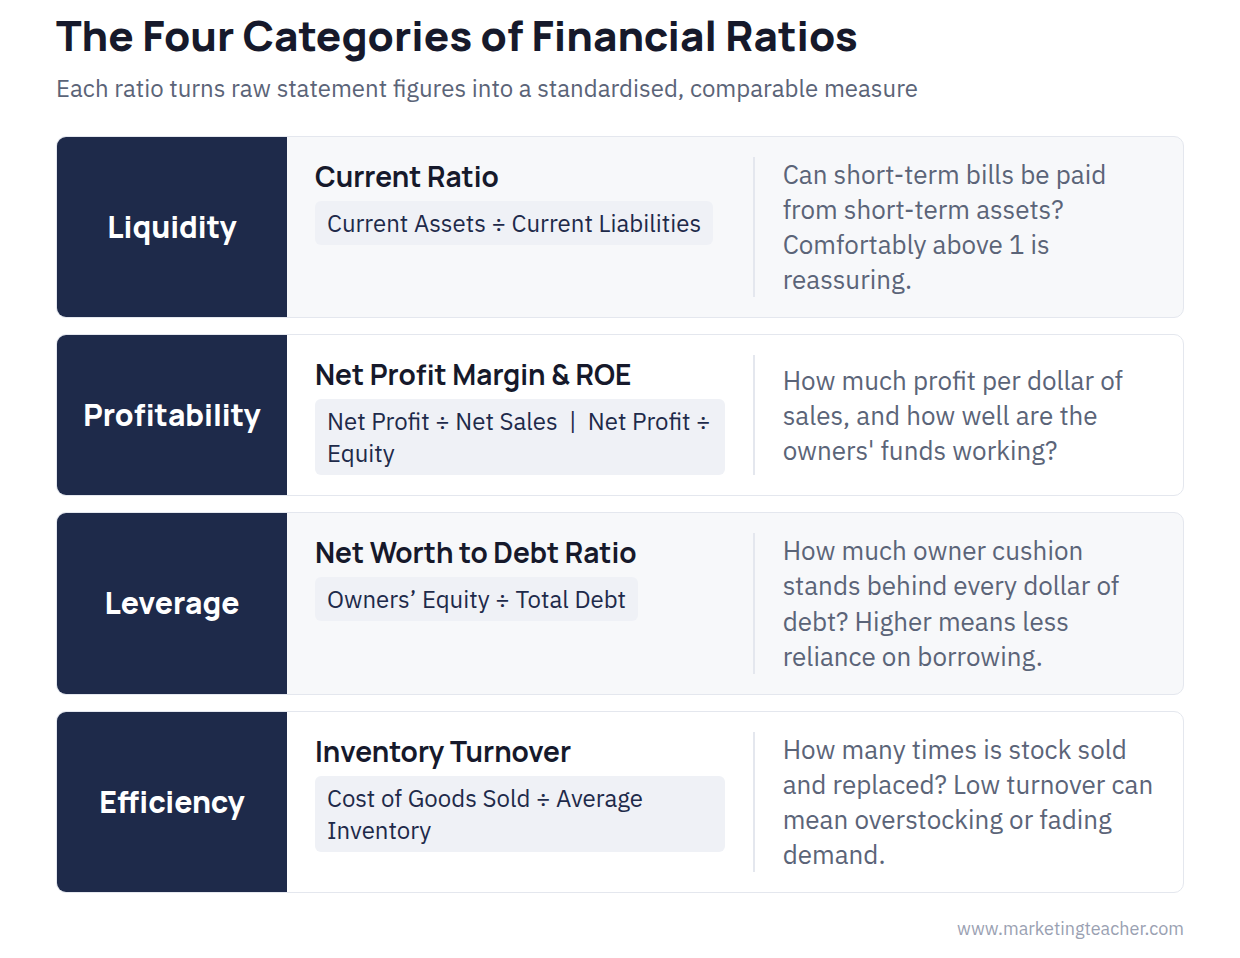
A financial ratio takes two figures from a company’s financial statements and divides one by the other, turning raw numbers into a standardised measure that can be compared across time periods or against other businesses. Ross, Westerfield and Jordan (2022) note that a single number, such as $500,000 in profit, tells you very little on its own; it only becomes meaningful once it is related to something else, such as the sales or assets it took to generate it. Marketers who understand ratios can judge whether a business genuinely has the financial strength to support a proposed campaign, rather than relying on a headline profit figure that may hide a weak cash position or a heavily indebted balance sheet.
Liquidity Ratios: Can the Business Pay Its Short-Term Bills?
Liquidity ratios measure whether a business can cover its short-term obligations using its short-term assets. The current ratio divides current assets by current liabilities; a result comfortably above 1 suggests the business can meet bills due within the year. The quick ratio, sometimes called the acid-test ratio, is a stricter version that subtracts inventory from current assets first, since inventory can be slow or difficult to convert to cash. A retailer sitting on large amounts of unsold stock might show a healthy current ratio while its quick ratio tells a much more cautious story.
Profitability Ratios: Is the Business Making Money Efficiently?
Profitability ratios measure how efficiently a business turns sales or investment into profit. Net profit margin divides net profit by net sales, showing how many cents of profit are earned from every dollar of revenue after all costs are accounted for. Return on equity (ROE) divides net profit by owners’ equity, showing how effectively the business is using the money its owners have invested in it. Two companies with identical sales figures can have very different net profit margins, and comparing the ratio over several years is usually more revealing than looking at a single period in isolation.
Leverage (Solvency) Ratios: How Much Debt Is Backing the Business?
Leverage, or solvency, ratios measure how much of a business is financed by debt rather than by its owners’ own investment. The Net Worth to Debt Ratio divides owners’ equity (net worth) by total debt, showing how much cushion the owners’ own stake provides against what is owed to lenders; a higher ratio means the business relies less heavily on borrowed money. A closely related measure, the debt-to-equity ratio, simply inverts the comparison, dividing total debt by owners’ equity. For Larkspur Home Goods, the Net Worth to Debt Ratio is 1.4 ($210,000 / $150,000), meaning the owners’ stake is 1.4 times the size of the company’s debt, a reasonably comfortable position. A business with a low Net Worth to Debt Ratio may still be profitable, but it carries more risk, since a downturn in sales leaves less of an equity cushion to absorb losses before creditors are affected.
Efficiency Ratios: How Well Are Assets Being Used?
Efficiency ratios measure how productively a business is using what it owns. Inventory turnover divides the cost of goods sold by average inventory, showing how many times inventory is sold and replaced over a period. A low inventory turnover can signal overstocking, weak demand, or products that are becoming outdated on the shelf, all of which a marketing team should care about, since a promotion aimed at moving slow stock is a very different task from a promotion aimed at capturing new demand for a fast-moving product.
Using Ratios Together, Not in Isolation
No single ratio tells the whole story, which is why analysts typically look at several ratios from different categories side by side, alongside the underlying financial statements the ratios are calculated from. A strong profitability ratio paired with a weak liquidity ratio might mean a business is profitable on paper but could struggle to pay its bills on time; a strong liquidity position paired with weak efficiency ratios might mean cash is simply sitting idle in slow-moving inventory rather than being put to productive use. Ratios are also most useful when tracked over several periods or benchmarked against competitors in the same industry, since what counts as a “good” ratio varies considerably between, for example, a capital-intensive manufacturer and a low-inventory service business.
Summary
Financial ratios, liquidity, profitability, leverage and efficiency among the main categories, convert raw financial statement figures into standardised measures that can be tracked over time and compared against other businesses (Ross, Westerfield and Jordan, 2022). A marketer who can read ratios such as the current ratio, net profit margin, return on equity, the Net Worth to Debt Ratio and inventory turnover is far better placed to judge whether a business genuinely has the financial strength to support a proposed campaign, rather than relying on a single profit figure that can hide real underlying weakness.
The slides, worksheet, lesson plan and poster for this lesson are free to download and free to use in your course — no sign-up, no permission needed. See the teacher resources →
Assign this lesson to your class:
Using Canvas, Blackboard or Moodle? Copy the link and paste it into your course page or assignment. More ways to add lessons to your LMS.

