
What is international marketing research, and why is it harder?
International marketing research is the gathering and analysis of information to support marketing decisions in more than one country. It uses the same tools as any other research. If you are new to the topic, start with what international marketing involves and then come back here.
The difference is that every step gets harder once a border is crossed. Data is collected by different bodies, in different years, using different definitions. Questionnaires must be translated. Customers in one country answer rating scales differently from customers in another. Craig and Douglas (2005) stress that findings from different countries are only useful if they can be compared fairly. A review of 1,722 articles published between 1995 and 2015 found that research in this field has grown and become more sophisticated (Leonidou et al., 2018), but the basic problem of comparison has not gone away.
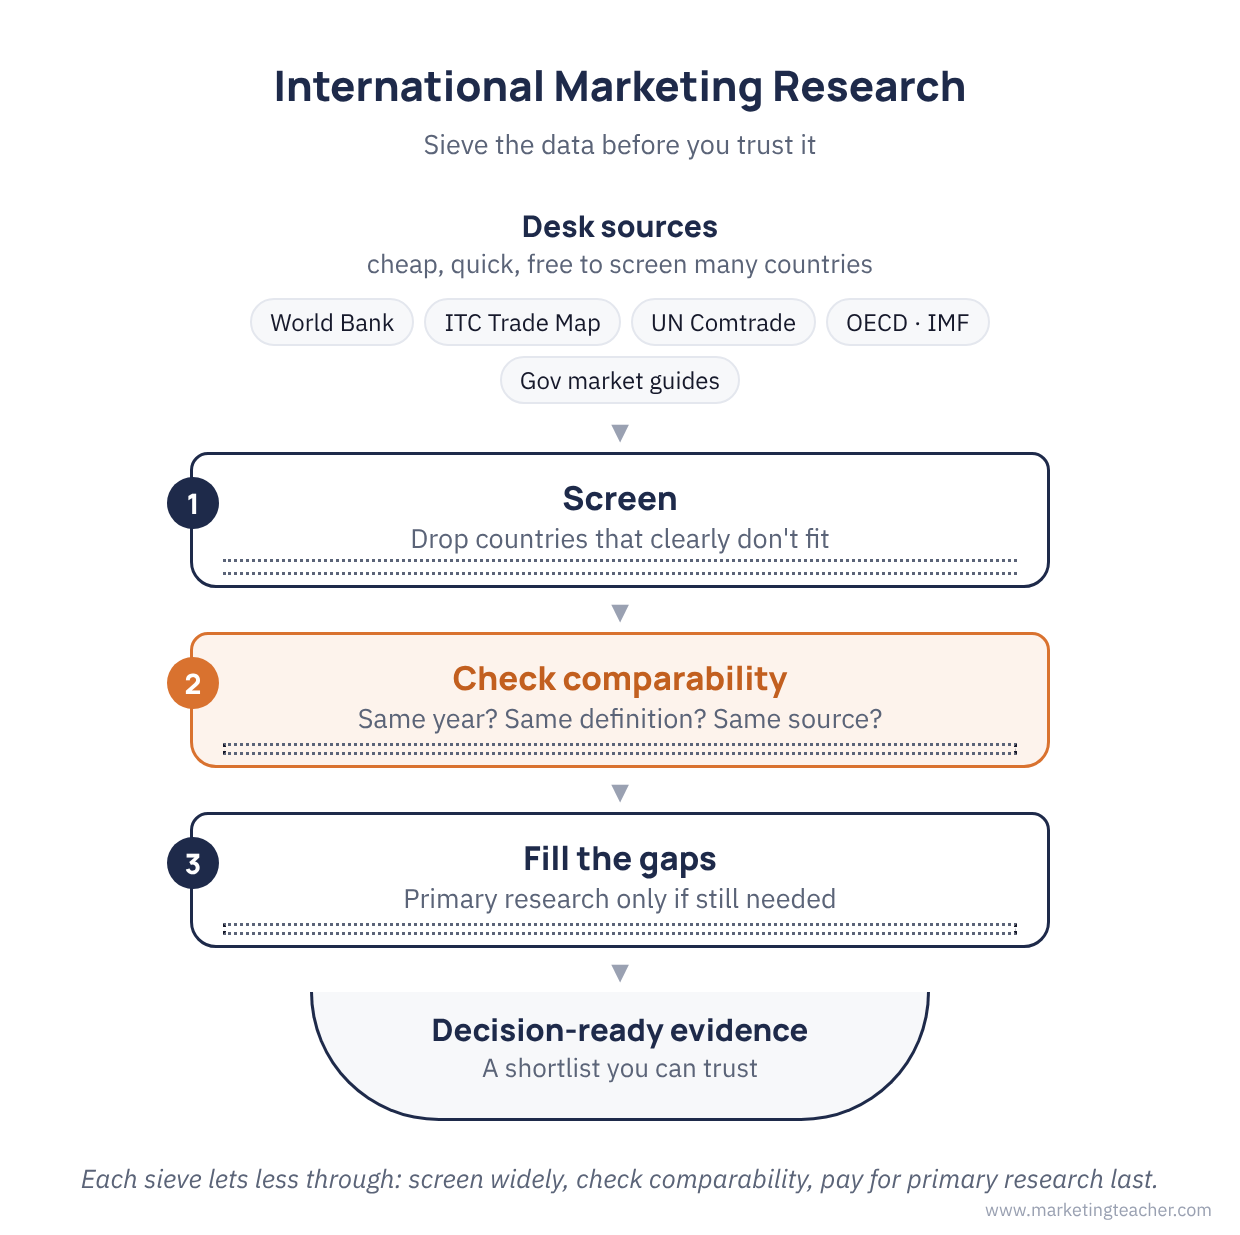
Secondary (desk) sources for international markets
Most international research starts at a desk. Secondary research is cheap, quick and good for screening many countries before you spend money on any of them. These sources are a strong starting point, and most are free:
- World Bank Open Data (World Development Indicators). Over 1,500 indicators for more than 200 countries, such as population, GDP per capita and internet use. Good for a first comparison of market size and wealth.
- ITC Trade Map. Run by the International Trade Centre. Trade flows for over 220 countries and 5,300 products. Good for seeing who imports your product, how much, and from whom.
- UN Comtrade. The United Nations’ detailed trade database, covering around 200 countries. Good for checking product-level import and export values by partner country.
- OECD Data and the IMF. The OECD covers richer economies in depth. The IMF’s World Economic Outlook gives GDP figures and forecasts. Good for economic trends and outlooks.
- National statistics offices. For example, Japan’s Statistics Bureau and the e-Stat portal. Good for local detail that global databases do not hold.
- UK government market guides. Business.gov.uk (formerly great.gov.uk) publishes export market guides by country, with trade figures, trade barriers and duties. It is now run by the Department for Business, Innovation, Science and Trade.
- Company and industry reports. Annual reports of competitors, trade associations and commercial market reports. Good for market shares and competitor moves, though paid reports can be costly.
Use these sources to build a picture of each country’s political, economic and social conditions, much as you would in a PESTEL scan. This feeds directly into the market entry evaluation process.
Using AI tools for desk research
AI chat tools can speed up desk research. They can scan long reports, summarise a country’s trade rules, and suggest which indicators to look at. Some official services now offer them. Business.gov.uk, for example, is trialling an AI assistant that answers questions from government information.
The risk is that AI tools can produce figures that look precise but are wrong or out of date. They may mix years, mix sources, or invent a statistic. So treat AI output as a lead, not as evidence. Every number must be traced back to its original source, such as the World Bank or UN Comtrade, before it goes into a report. You can read more about marketing and AI in a separate lesson.
The main challenges
Comparability of data. Countries define and collect data differently. Even the same measure can vary by source. The World Bank puts Japan’s 2024 GDP per capita at about US$33,800, while the IMF figure shown on the UK government’s Japan guide is about US$32,500. Always check the year, the definition and the source.
Translation. A questionnaire must mean the same thing in every language. The usual check is back-translation: one person translates, another translates it back, and the two versions are compared. Douglas and Craig (2007) warn that this only checks literal wording. They suggest a team of translators who work together and revise the wording in rounds.
Equivalence. Craig and Douglas (2005) set out several types. Conceptual equivalence asks whether an idea, such as “convenience”, means the same thing in each country. Functional equivalence asks whether a product does the same job; a bicycle may be leisure in one market and basic transport in another. Measurement equivalence asks whether scales, units and questions are read the same way.
Sampling frames. A list of the population you want to survey may not exist abroad, or may be out of date. Telephone and address lists vary widely in quality.
Cultural response styles. Some groups tend to agree with statements (acquiescence). Others favour the end points of a scale (extreme responding). Baumgartner and Steenkamp (2001) studied 11 European Union countries and found that these styles distort scale scores and the links between them. So a higher score in one country may reflect answering style, not stronger attitudes.
Cost and access. Fieldwork abroad needs local agencies, interpreters and travel. Some markets restrict data collection or data transfer.
When is primary research abroad worth doing?
Primary research is worth the cost when desk data cannot answer a key question. Typical cases are testing whether a product concept appeals locally, setting a price, or checking a brand name. Do it once the shortlist is down to one or two countries, and use local partners who understand the culture.
Summary
International marketing research uses familiar tools in a harder setting. Desk sources such as the World Bank, ITC Trade Map, UN Comtrade, the OECD, the IMF, national statistics offices and UK government market guides let you screen markets cheaply. AI tools can speed this up, but every figure must be checked at source. The main challenges are comparability, translation, equivalence, sampling frames, response styles and cost. Primary research comes last, when the desk data runs out.
The slides, worksheet, lesson plan and poster for this lesson are free to download and free to use in your course — no sign-up, no permission needed. See the teacher resources →
Assign this lesson to your class:
Using Canvas, Blackboard or Moodle? Copy the link and paste it into your course page or assignment. More ways to add lessons to your LMS.

